Free Access
Fig. 2
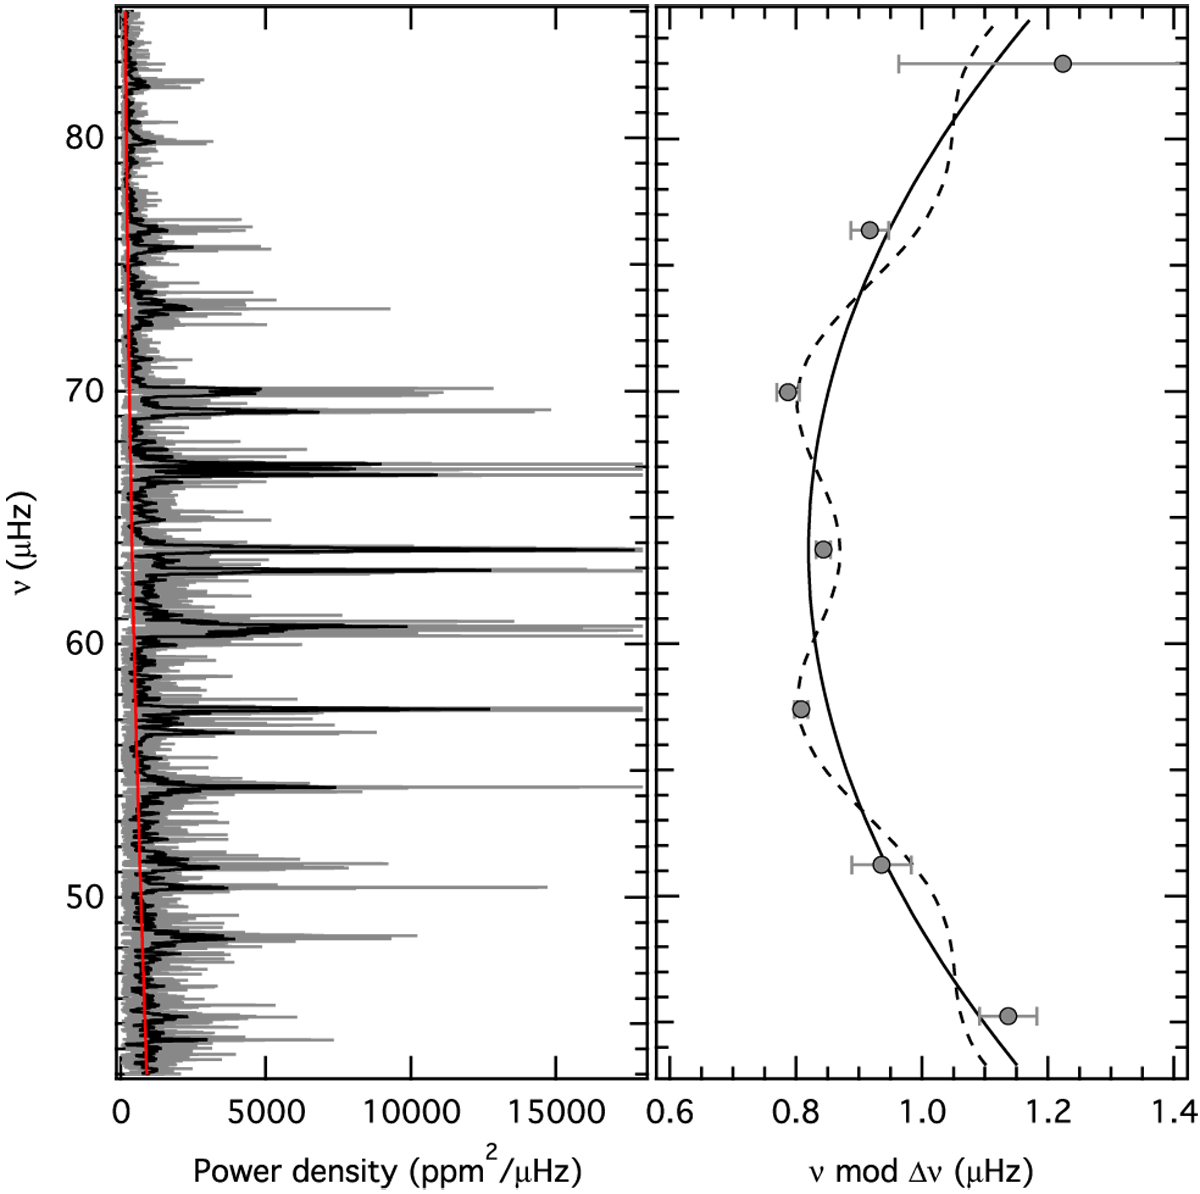
Left: original (grey line) and smoothed (black line) power density spectrum of KIC 9970396. The red line indicates the granulation background. Right: échelle diagram of the significant radial modes. The solid and dashed lines correspond to our asymptotic fit (Eq. (6)) and the curvature term of the fit, respectively.
Current usage metrics show cumulative count of Article Views (full-text article views including HTML views, PDF and ePub downloads, according to the available data) and Abstracts Views on Vision4Press platform.
Data correspond to usage on the plateform after 2015. The current usage metrics is available 48-96 hours after online publication and is updated daily on week days.
Initial download of the metrics may take a while.