Fig. 13
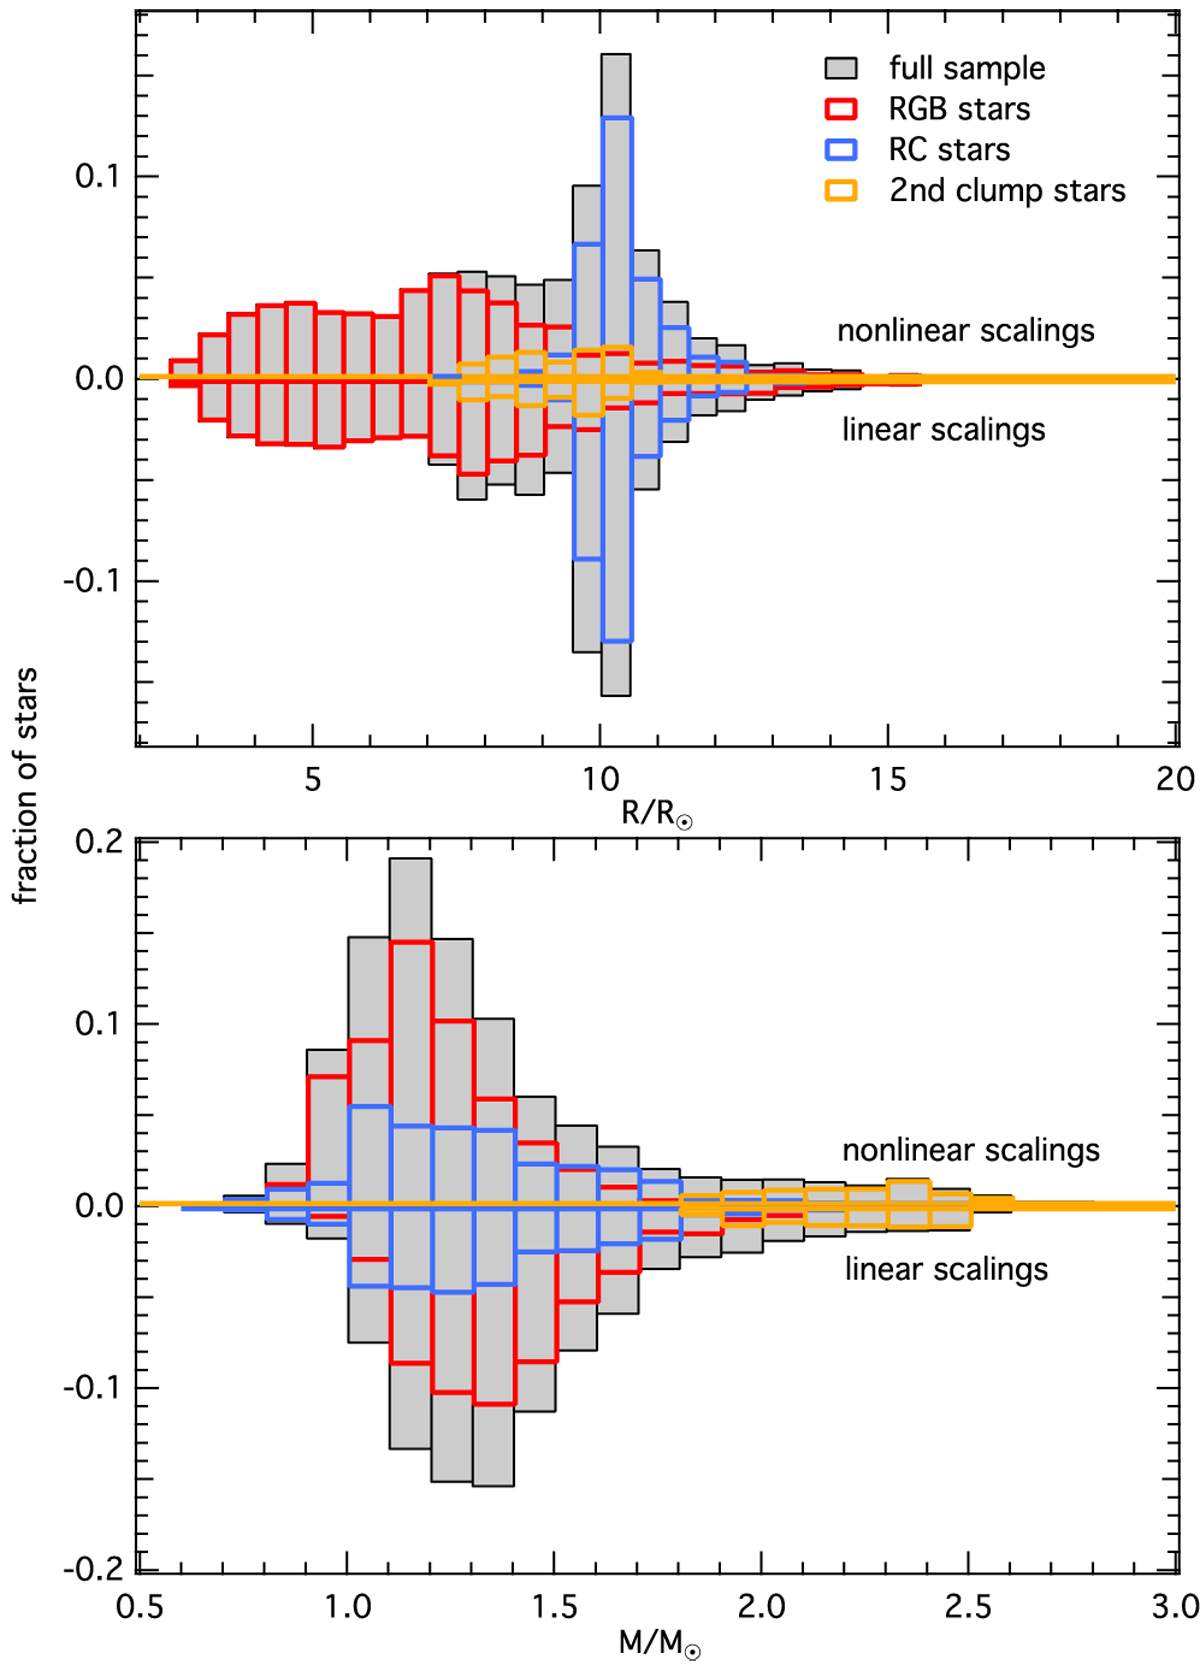
Radius (top panel) and mass (bottom panel) distributions of about 5100 red giants from the APOKASC sample computed from grid modelling based on our new non-linear scalings with νmax and Δνcor as seismic input (upwards pointing) and the classical linear scalings (downwards pointing). The full sample and subsamples corresponding to the different evolutionary stages are shown by grey and coloured bars, respectively.
Current usage metrics show cumulative count of Article Views (full-text article views including HTML views, PDF and ePub downloads, according to the available data) and Abstracts Views on Vision4Press platform.
Data correspond to usage on the plateform after 2015. The current usage metrics is available 48-96 hours after online publication and is updated daily on week days.
Initial download of the metrics may take a while.