Fig. 10
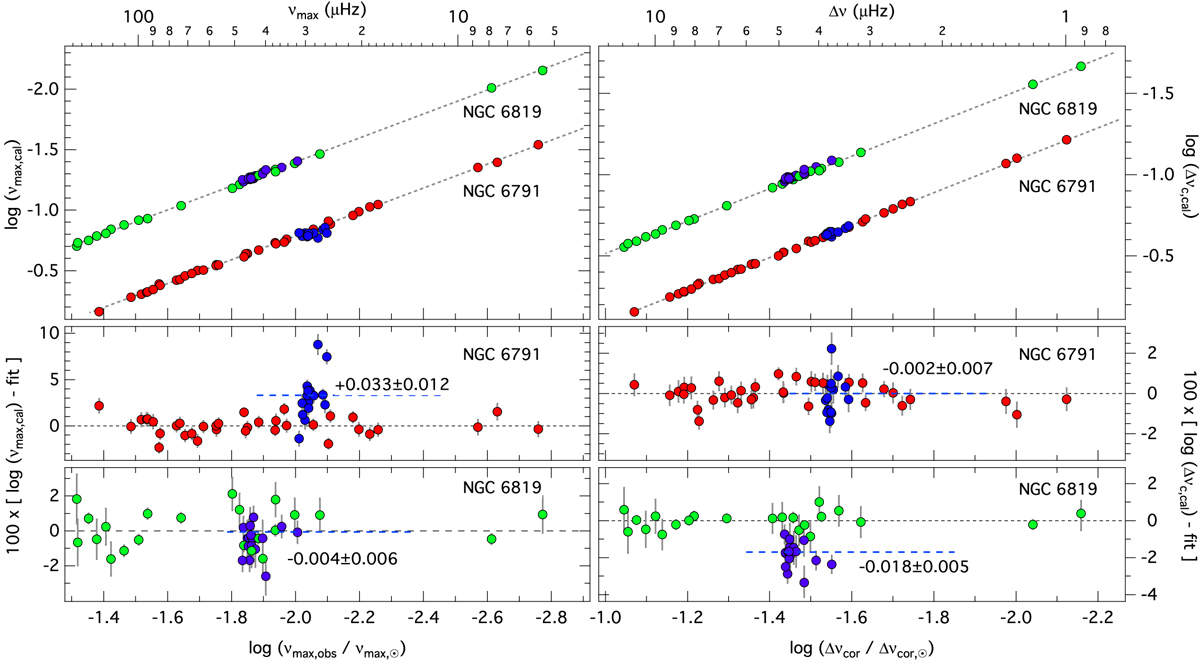
Top panels: mbol and Teff scaled νmax,cal (left) and Δνcor,cal (right) as a function of the observed parameters for the sample of RGB (red and green dots) and RC (blue dots) in NGC 6791 and NGC 6819, respectively. The dashed lines indicate linear fits (in log-log scale) to the RGB stars, which correspond to power-law fits in linear scale. The panels are plotted upside down so that bright stars are at the top. Middle and bottom panels: residuals to the fits. The blue dashed lines indicate the average offset of RC stars with the mean valuesand rms scatter given.
Current usage metrics show cumulative count of Article Views (full-text article views including HTML views, PDF and ePub downloads, according to the available data) and Abstracts Views on Vision4Press platform.
Data correspond to usage on the plateform after 2015. The current usage metrics is available 48-96 hours after online publication and is updated daily on week days.
Initial download of the metrics may take a while.