Fig. 9
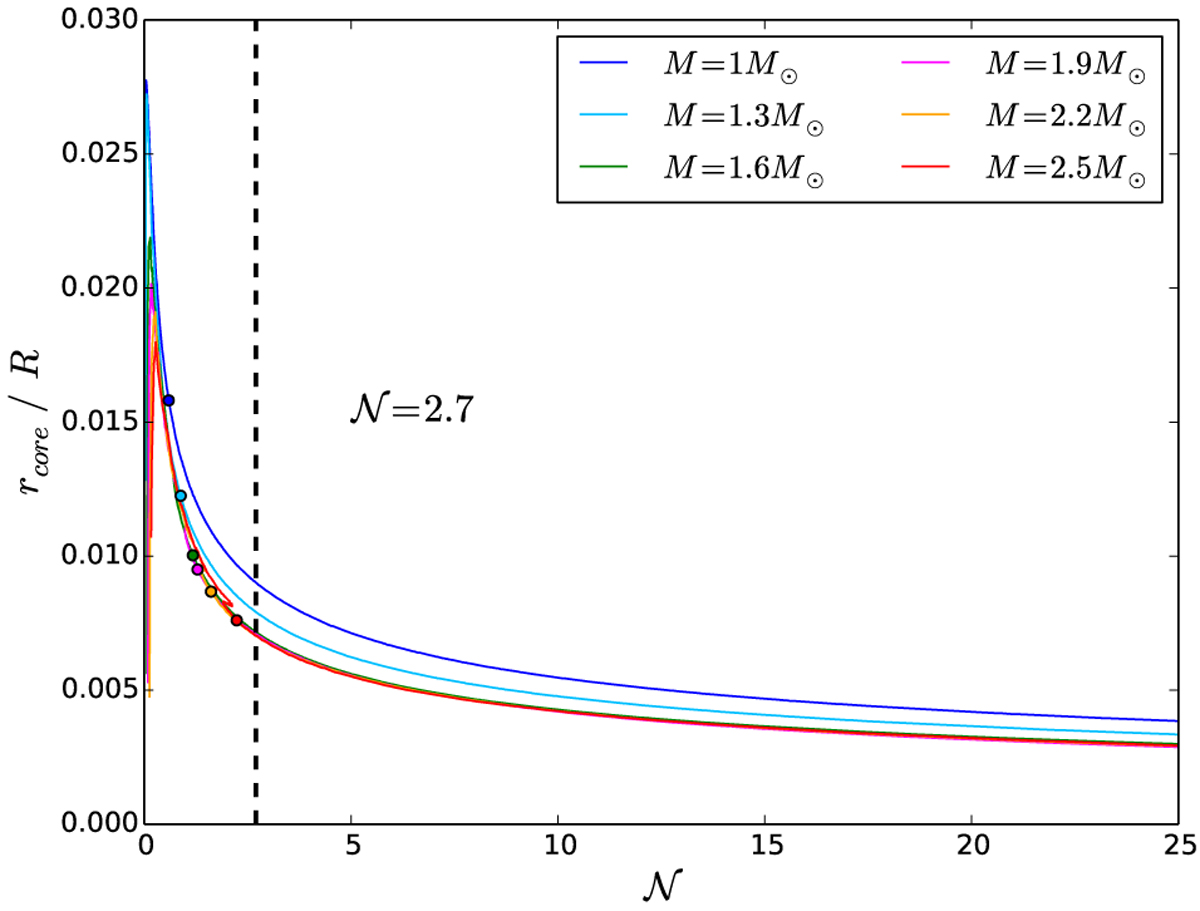
Evolution of the relative position of the core boundary, namely the radius of the core normalized to the total stellar radius, as a function of the mixed-mode density
![]() , for different stellar masses, computed with MESA. The colour code for the evolutionary sequences and dots locating the bottom of the red giant branch is the same as in Fig. 8. The vertical black dashed line has the same meaning as in Fig. 8. The tracks corresponding to M ≥ 1.6 M⊙ are superimposed.
, for different stellar masses, computed with MESA. The colour code for the evolutionary sequences and dots locating the bottom of the red giant branch is the same as in Fig. 8. The vertical black dashed line has the same meaning as in Fig. 8. The tracks corresponding to M ≥ 1.6 M⊙ are superimposed.
Current usage metrics show cumulative count of Article Views (full-text article views including HTML views, PDF and ePub downloads, according to the available data) and Abstracts Views on Vision4Press platform.
Data correspond to usage on the plateform after 2015. The current usage metrics is available 48-96 hours after online publication and is updated daily on week days.
Initial download of the metrics may take a while.