Fig. 8
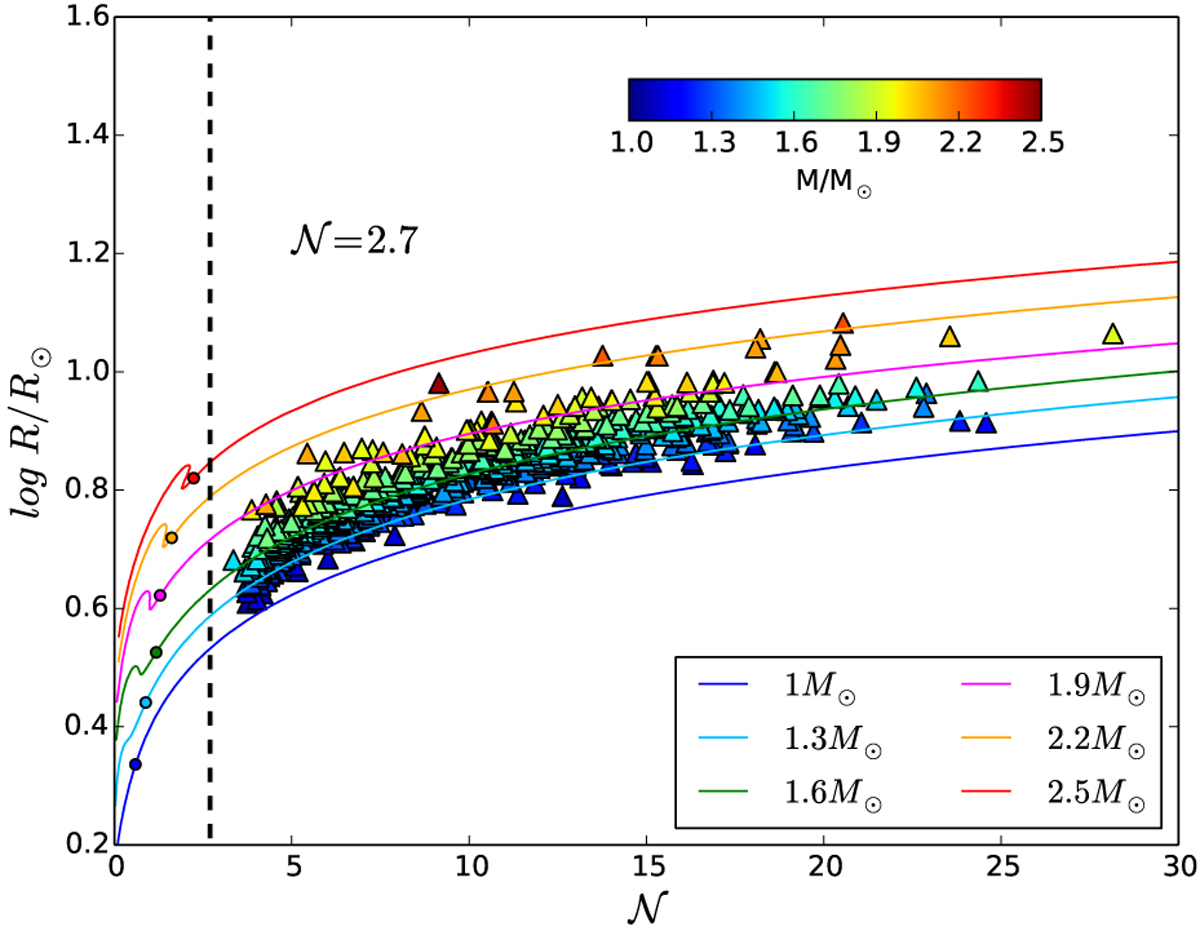
Evolution of the radius as a function of the mixed-mode density on the red giant branch. Coloured triangles represent the measurements obtained in this study, the colour coding represents the mass estimated from the asteroseismic global parameters. Evolutionary tracks are computed with MESA for different masses. The coloured dots indicate the bottom of the RGB for the different masses. The vertical black dashed line indicates the lower observational limit for the mixed-mode density,
![]() .
.
Current usage metrics show cumulative count of Article Views (full-text article views including HTML views, PDF and ePub downloads, according to the available data) and Abstracts Views on Vision4Press platform.
Data correspond to usage on the plateform after 2015. The current usage metrics is available 48-96 hours after online publication and is updated daily on week days.
Initial download of the metrics may take a while.