Fig. 3
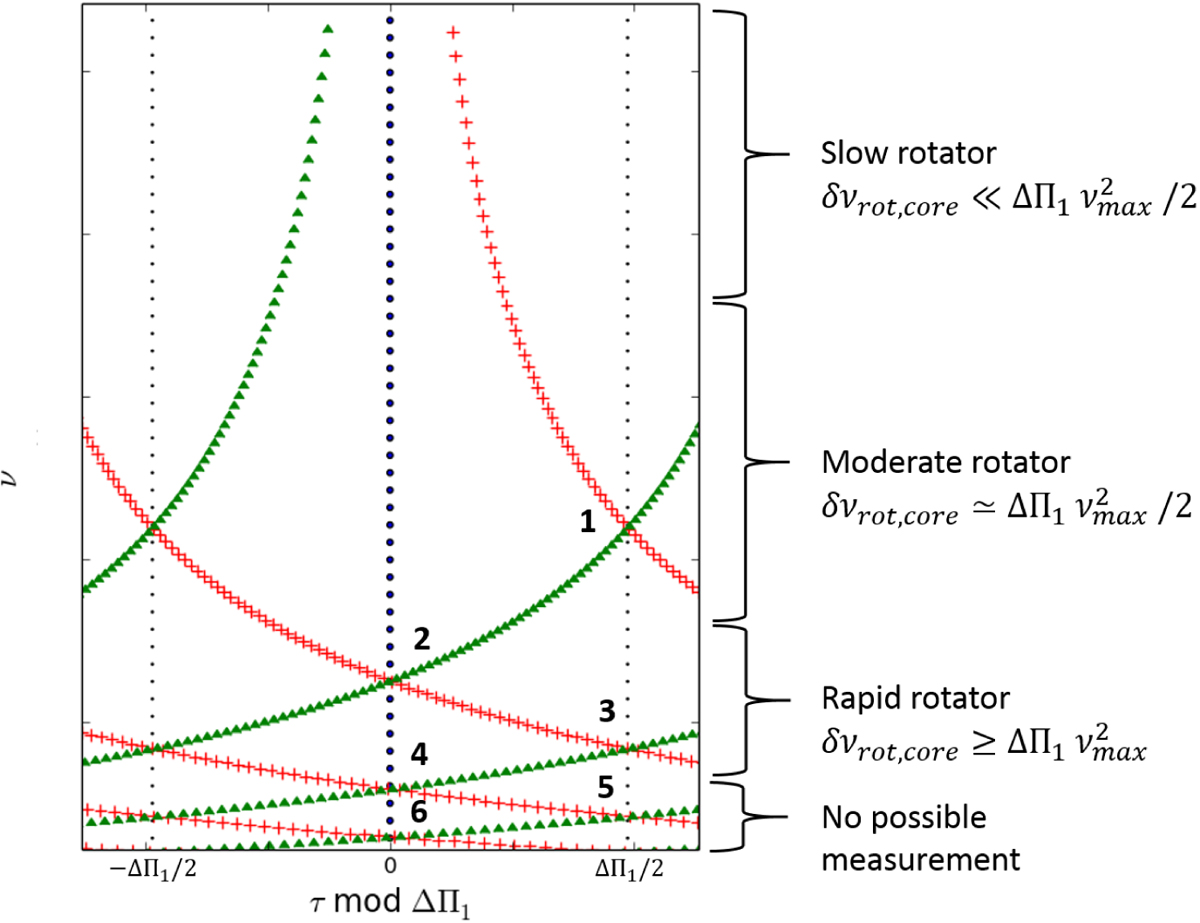
Synthetic stretched period échelle diagram built from Eqs. (9) and (10). The colours indicate the azimuthal order: the m = {−1, 0, +1} rotational components are given by green triangles, blue dots, and red crosses, respectively. The small black dots represent
![]() mod Δ Π1. The numbers mark the crossing order k (Eq. (18)). As the number of observable modes is limited, they cover only a limited frequency range in the diagram.
mod Δ Π1. The numbers mark the crossing order k (Eq. (18)). As the number of observable modes is limited, they cover only a limited frequency range in the diagram.
Current usage metrics show cumulative count of Article Views (full-text article views including HTML views, PDF and ePub downloads, according to the available data) and Abstracts Views on Vision4Press platform.
Data correspond to usage on the plateform after 2015. The current usage metrics is available 48-96 hours after online publication and is updated daily on week days.
Initial download of the metrics may take a while.