Fig. 12
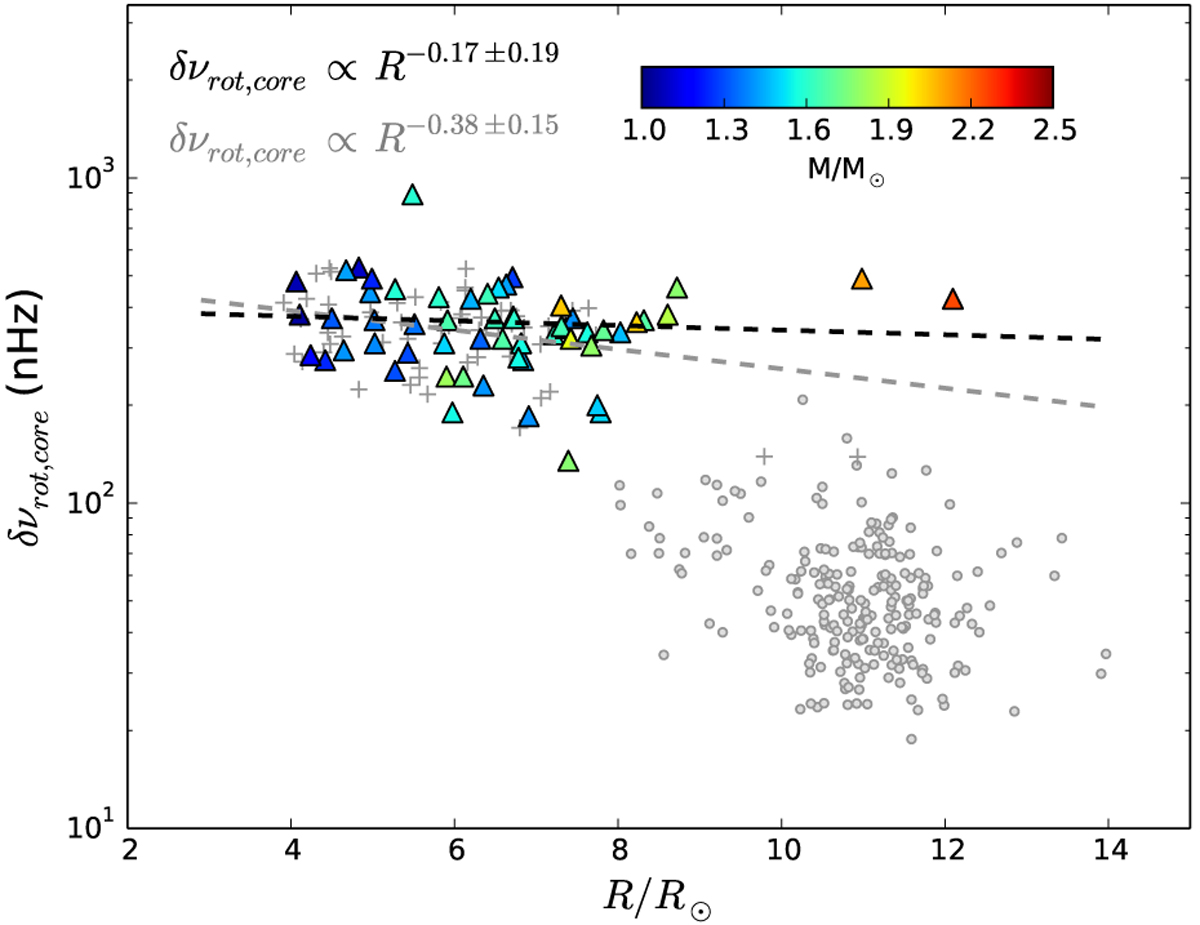
Mean core rotational splitting as a function of the radius estimated from the global asteroseismic parameters. Our measurements are represented by coloured triangles, the colour code being the same as in Fig. 5. Mosser et al. (2012b)’s measurements on the RGB and on the clump are represented by grey crosses and dots, respectively. RGB stars are common to our study and to the Mosser et al. (2012b) study. The linear fit resulting from our RGB measurements is plotted in black while the fit resulting from Mosser et al. (2012b) RGB measurements is represented in grey.
Current usage metrics show cumulative count of Article Views (full-text article views including HTML views, PDF and ePub downloads, according to the available data) and Abstracts Views on Vision4Press platform.
Data correspond to usage on the plateform after 2015. The current usage metrics is available 48-96 hours after online publication and is updated daily on week days.
Initial download of the metrics may take a while.