Fig. 11
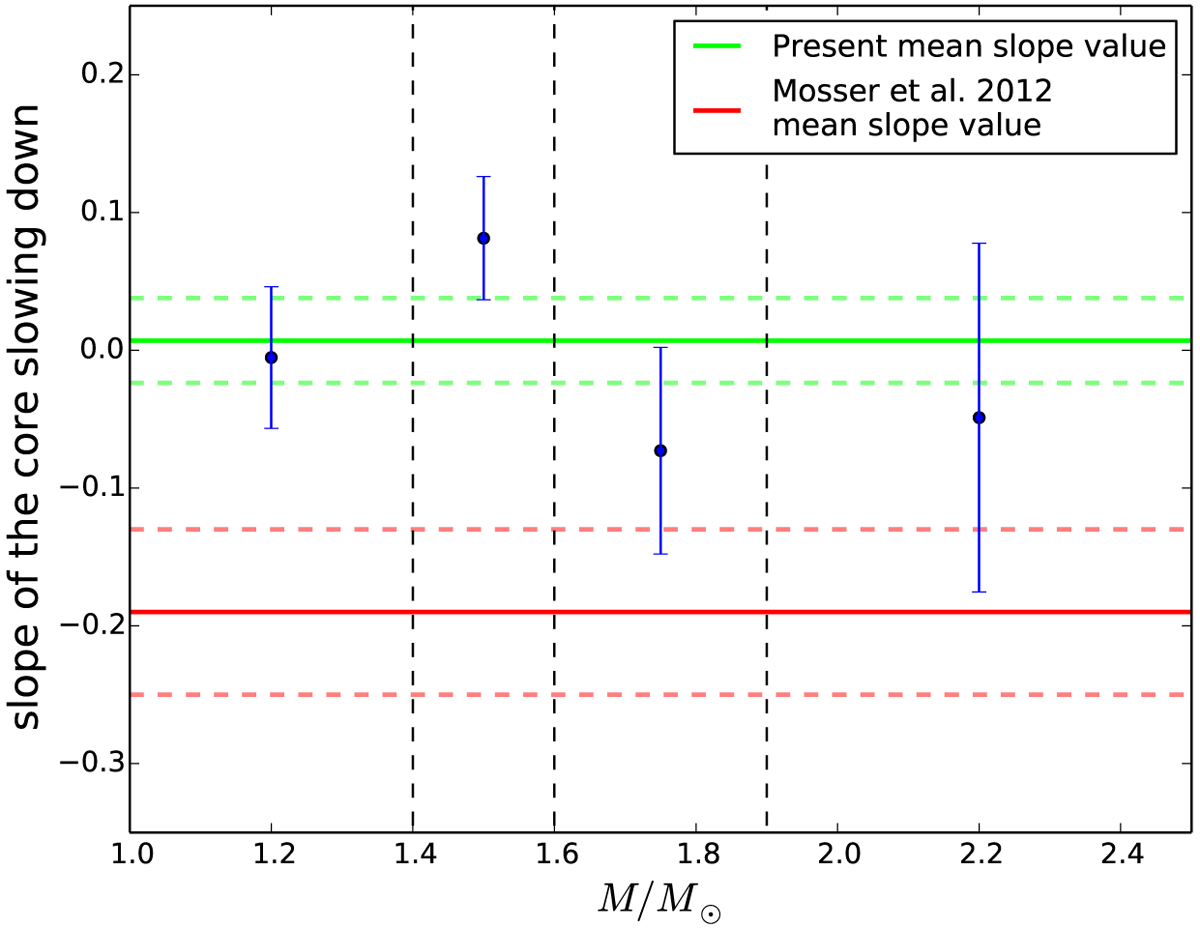
Slopes of the core slow-down a when considering the evolution of the core rotation as a function of the mixed-mode density
![]() measured through Eq. (10) for different mass ranges. Our measurements and the associated error bars are represented in blue. Vertical black dashed lines mark the boundaries between the different mass ranges considered. The green and red solid and dashed lines indicate the value of the slow-down rate and the associated error bars measured in this study from a fit to all stars ⟨a⟩ and derived from all Mosser et al. (2012b) measurements on the red giant branch
measured through Eq. (10) for different mass ranges. Our measurements and the associated error bars are represented in blue. Vertical black dashed lines mark the boundaries between the different mass ranges considered. The green and red solid and dashed lines indicate the value of the slow-down rate and the associated error bars measured in this study from a fit to all stars ⟨a⟩ and derived from all Mosser et al. (2012b) measurements on the red giant branch
![]() , respectively.
, respectively.
Current usage metrics show cumulative count of Article Views (full-text article views including HTML views, PDF and ePub downloads, according to the available data) and Abstracts Views on Vision4Press platform.
Data correspond to usage on the plateform after 2015. The current usage metrics is available 48-96 hours after online publication and is updated daily on week days.
Initial download of the metrics may take a while.