Fig. 2
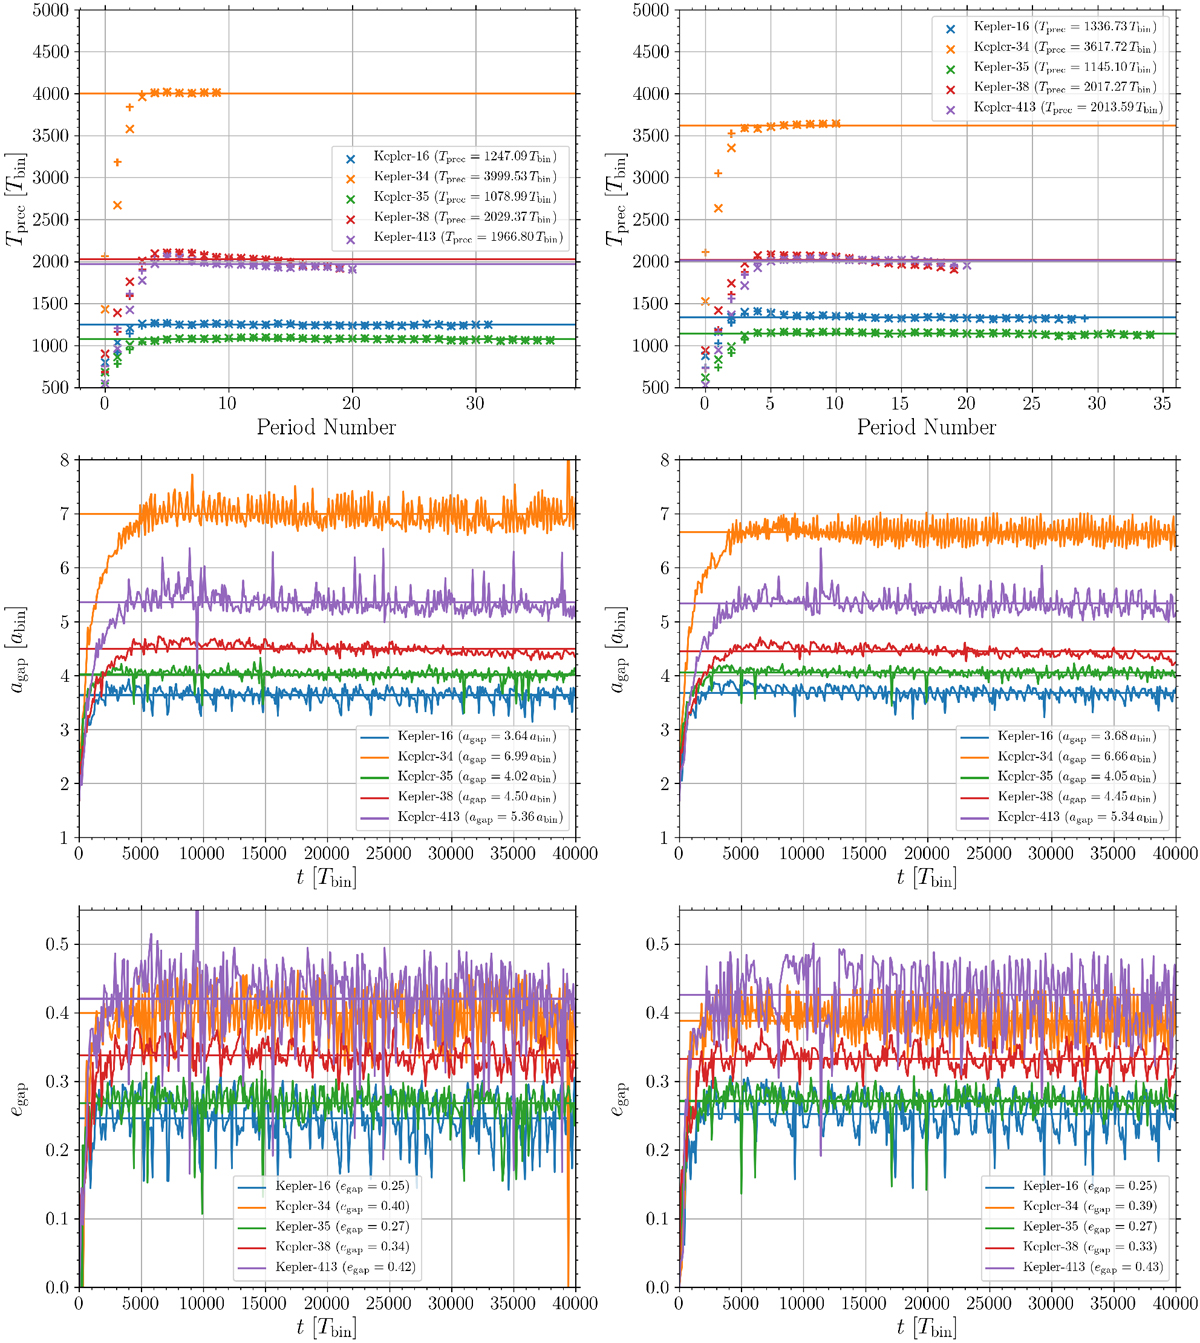
The precession period, semi-major axis, and eccentricity of the disc gap vs. time, for our five different systems. Disc models on the left are calculated with PLUTO and disc models on the right are calculated with FARGO3D. The precession period, Tprec, in the first row is given in terms of the corresponding period number. The horizontal lines indicate the time average starting from 6000 binary orbits, roughly the time when the discs reached a quasi-steady state. See the text for an explanation of the meaning of the + and × signs in the first row.
Current usage metrics show cumulative count of Article Views (full-text article views including HTML views, PDF and ePub downloads, according to the available data) and Abstracts Views on Vision4Press platform.
Data correspond to usage on the plateform after 2015. The current usage metrics is available 48-96 hours after online publication and is updated daily on week days.
Initial download of the metrics may take a while.