Fig. 1
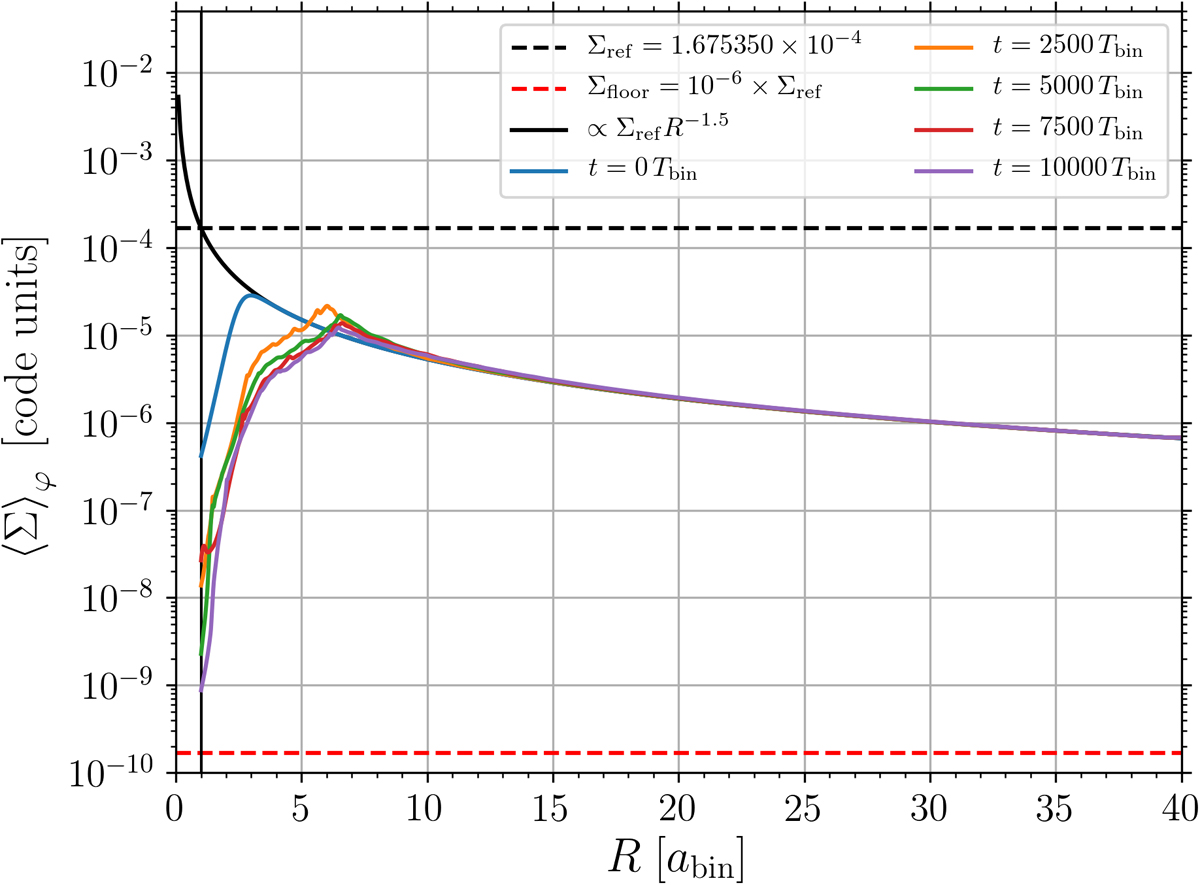
Azimuthally averaged surface density at various times for the Kepler-38 system calculated with PLUTO. The blue curve shows the initial density distribution. The black vertical line marks the 1 abin location where the density would reach the reference density if we had not imposed an initial gap (blue curve). The dashed horizontal lines mark the reference density (in black) and the density floor (in red).
Current usage metrics show cumulative count of Article Views (full-text article views including HTML views, PDF and ePub downloads, according to the available data) and Abstracts Views on Vision4Press platform.
Data correspond to usage on the plateform after 2015. The current usage metrics is available 48-96 hours after online publication and is updated daily on week days.
Initial download of the metrics may take a while.