Fig. 4
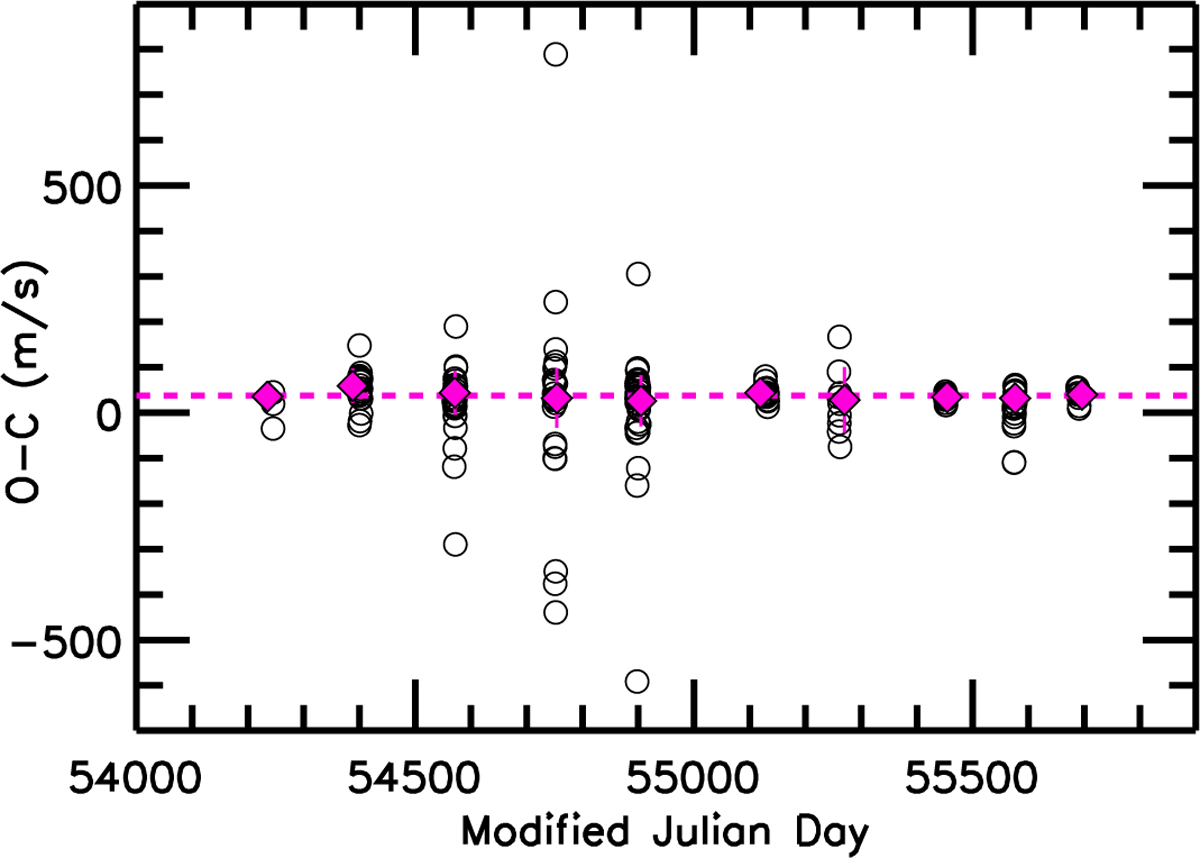
RV (O −C) of asteroids measured at different epochs from 2007 to 2011 as a function of time. Some runs have produced better quality measurements and show a lower dispersion. The red diamonds and error bars represent the weighted mean per run and its uncertainty (values reported in Table 2). The horizontal line marks the offset of 38 m s−1 applied to the catalogue to set its ZP on the asteroid scale.
Current usage metrics show cumulative count of Article Views (full-text article views including HTML views, PDF and ePub downloads, according to the available data) and Abstracts Views on Vision4Press platform.
Data correspond to usage on the plateform after 2015. The current usage metrics is available 48-96 hours after online publication and is updated daily on week days.
Initial download of the metrics may take a while.