Fig. 8
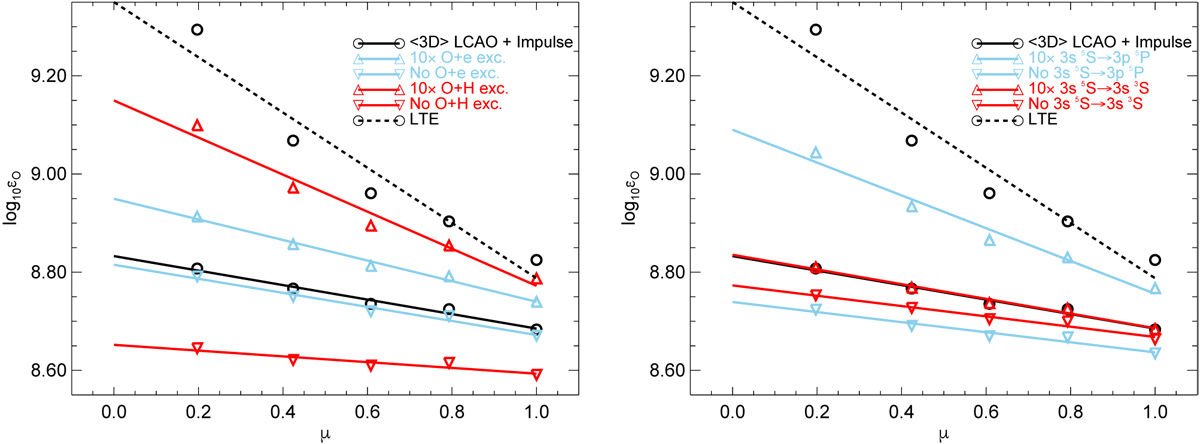
Abundances inferred at the different μ-pointings using the ⟨3D⟩ model solar atmosphere. The same abundance should be inferred from each μ-pointing (i.e. a flat line is expected). Left panel: effect of altering all inelastic O+e or O+H excitation rate coefficients. Right panel: effect of altering the inelastic O+e and O+H excitation rate coefficients (simultaneously) for the specified transition.
Current usage metrics show cumulative count of Article Views (full-text article views including HTML views, PDF and ePub downloads, according to the available data) and Abstracts Views on Vision4Press platform.
Data correspond to usage on the plateform after 2015. The current usage metrics is available 48-96 hours after online publication and is updated daily on week days.
Initial download of the metrics may take a while.