Fig. 1
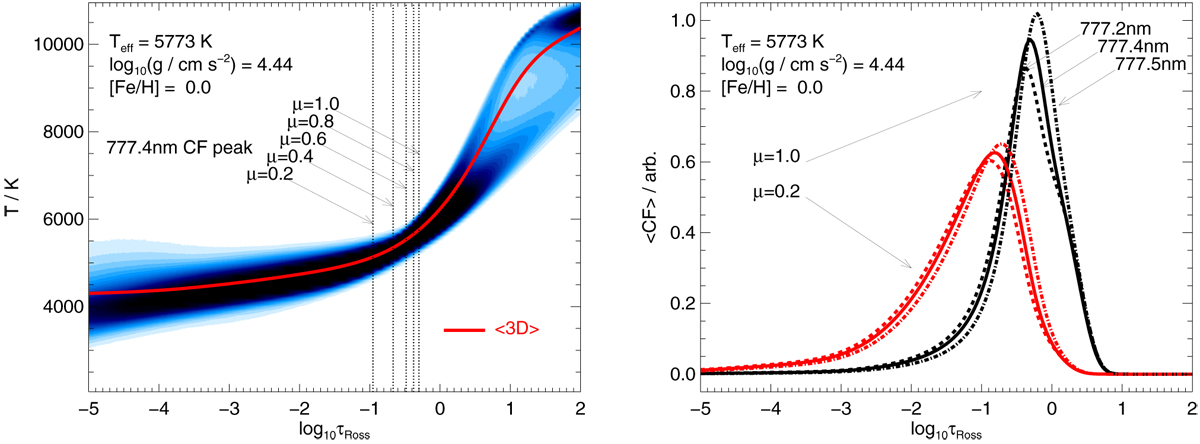
Leftpanel: temperature stratification of the hydrodynamic model solar atmosphere used in this work; also shown is the temperature stratification of the temporally and horizontally averaged ⟨3D ⟩ model solar atmosphere. Vertical lines are used to indicate the locations of the peaks of the temporally and horizontally averaged contribution functions at different inclinations. Right panel: contribution functions to the absolute intensity depression for the individual components of the O I 777 nm triplet and at different inclinations, calculated on the full 3D model solar atmosphere and subsequently temporally and horizontally averaged. The contribution functions have been normalised individually, such that the area under each is equal to unity.
Current usage metrics show cumulative count of Article Views (full-text article views including HTML views, PDF and ePub downloads, according to the available data) and Abstracts Views on Vision4Press platform.
Data correspond to usage on the plateform after 2015. The current usage metrics is available 48-96 hours after online publication and is updated daily on week days.
Initial download of the metrics may take a while.