Fig. 8

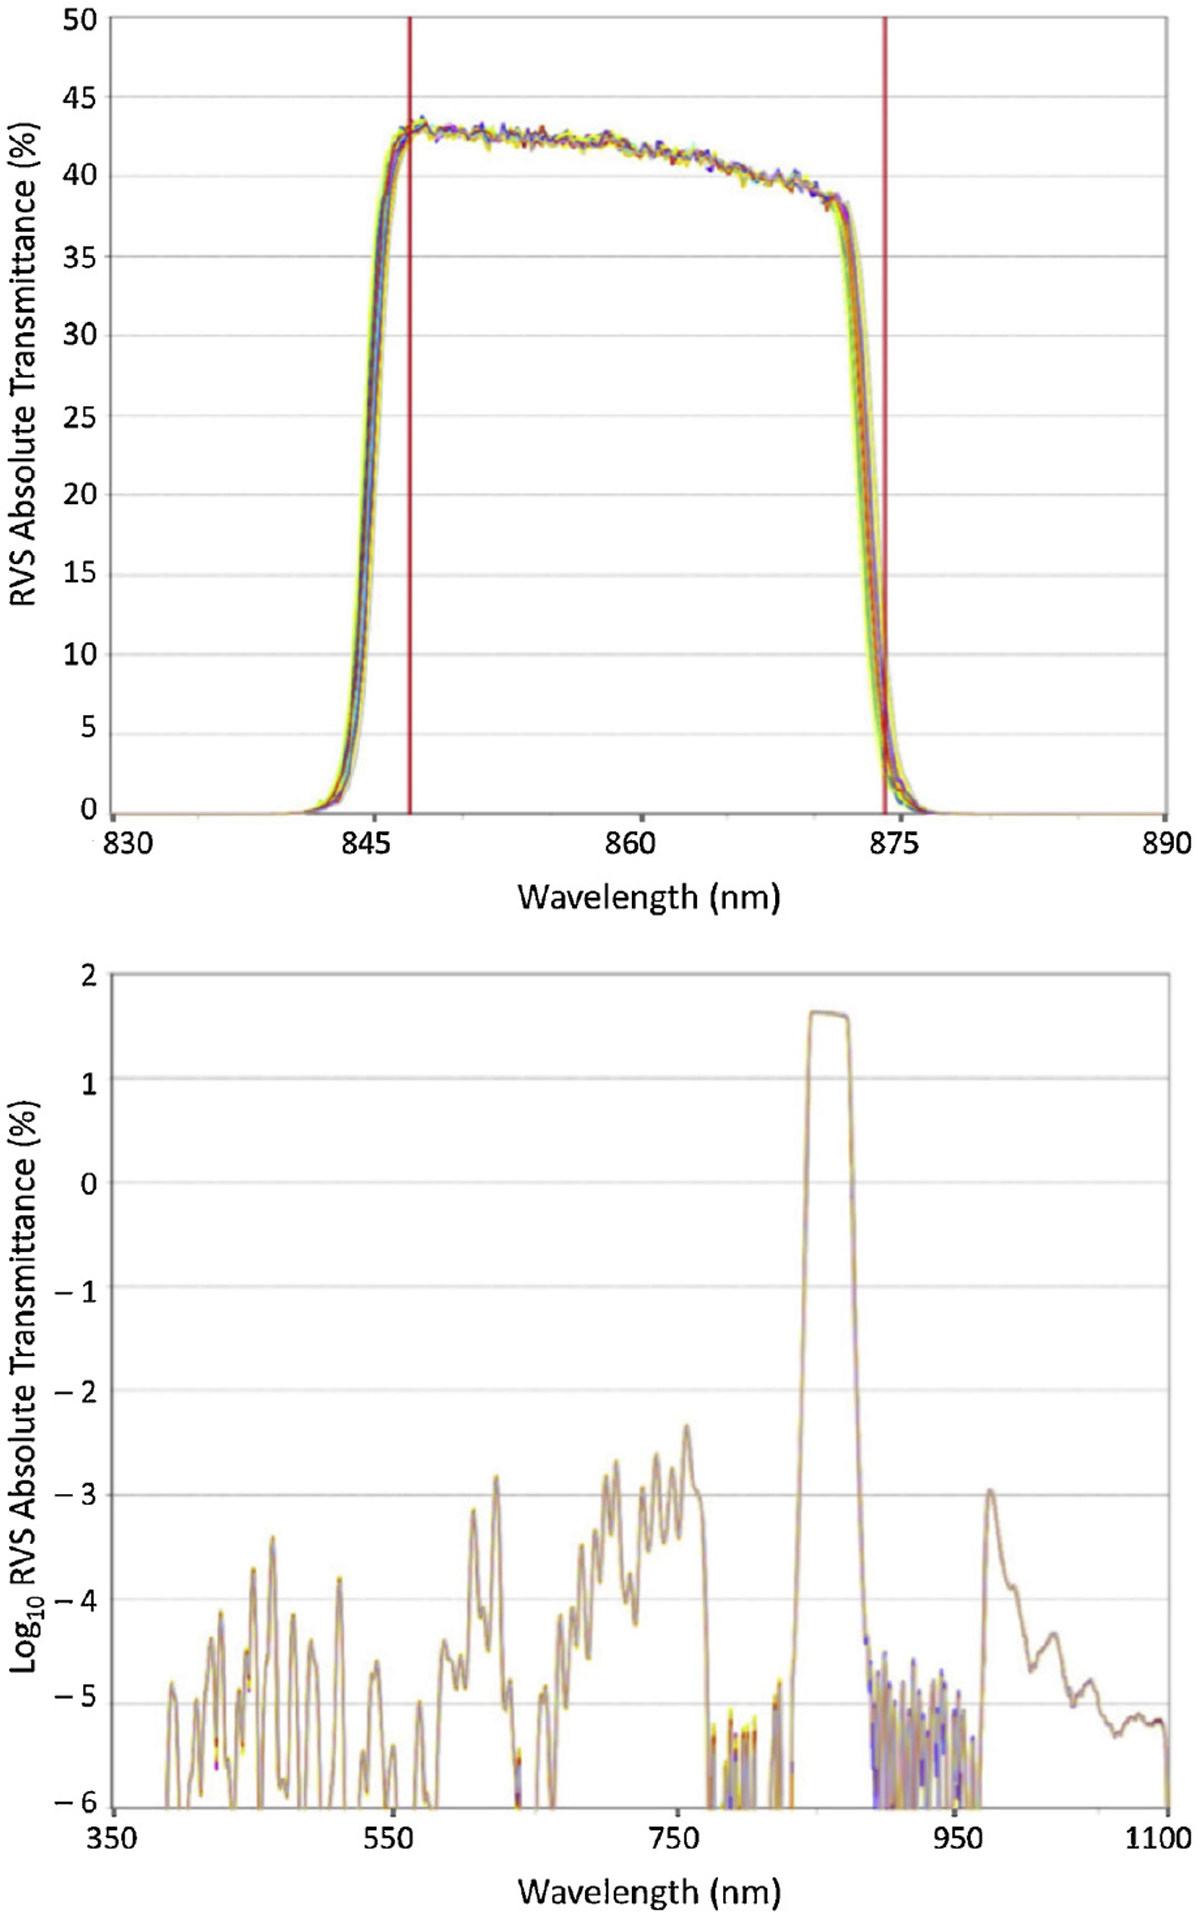
RVS flight model bandpass showing the absolute transmittance with the specified bandpass in vertical red lines (top) for thefull optical chain and detectors, and on a log scale, the out-of-band rejection (bottom). The different colours distinguish between the different field points for both telescopes, and hence the slightly different angles at which the rays traverse the filter coatings. From Chassat (2013).
Current usage metrics show cumulative count of Article Views (full-text article views including HTML views, PDF and ePub downloads, according to the available data) and Abstracts Views on Vision4Press platform.
Data correspond to usage on the plateform after 2015. The current usage metrics is available 48-96 hours after online publication and is updated daily on week days.
Initial download of the metrics may take a while.


