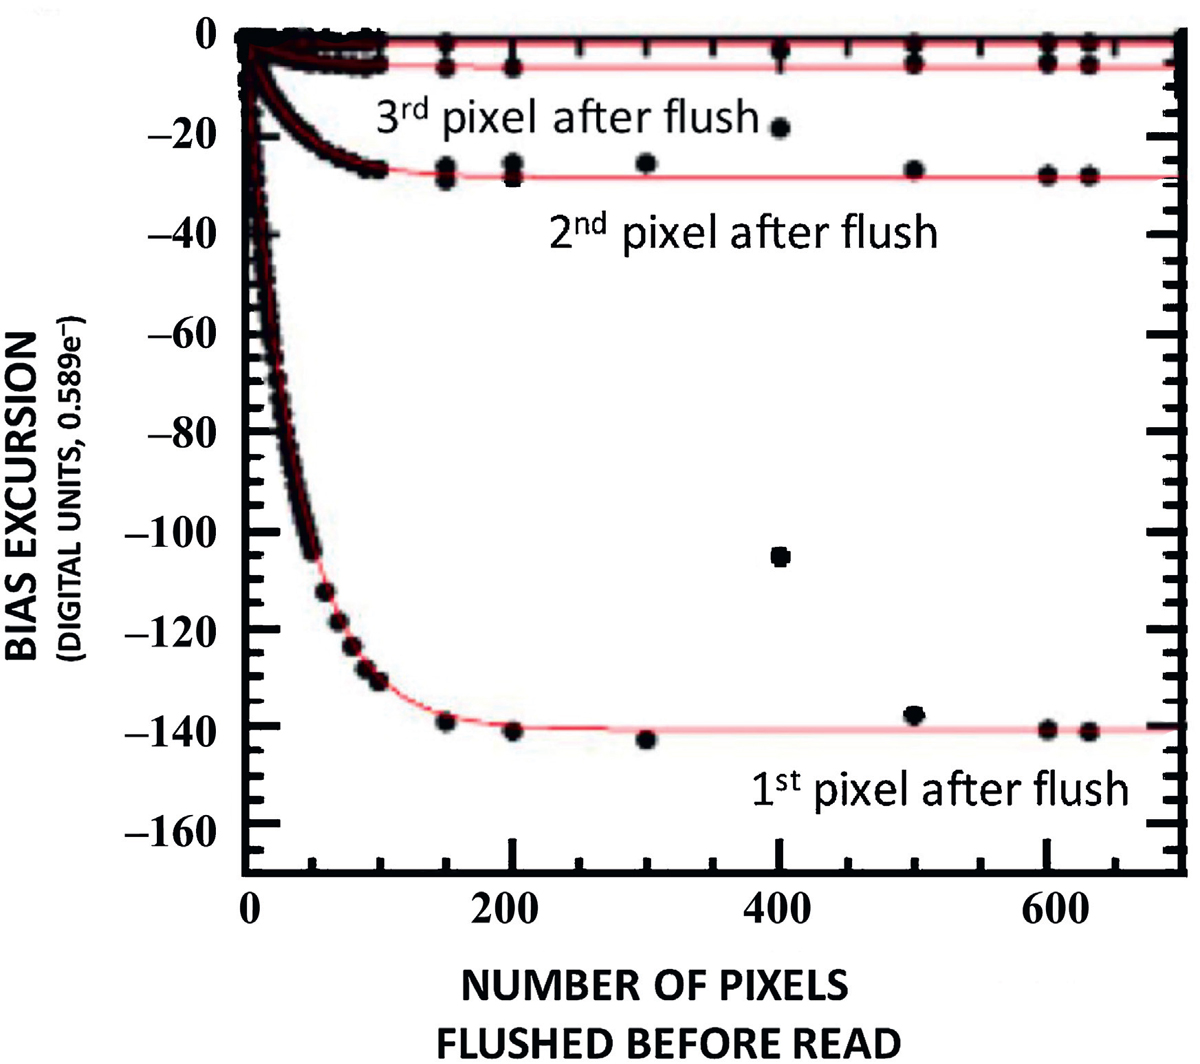
Fig. 10

Example of the calibration (red lines) of the bias non-uniformity (black dots) after a flush. Three groups of datapoints are evident: the lowest, corresponding to the maximum bias excursion, is the first pixel after the transition from flush to read; the middle and upper are the second and third pixels, respectively. The excursion depends strongly on how many flushes precede it (the horizontal axis), with the effect saturating after ~ 200 flushed pixels. The upwards excursion above the calibration line after 400 pixels is, in this particular case, the glitch caused by the pause in the serial readout.
Current usage metrics show cumulative count of Article Views (full-text article views including HTML views, PDF and ePub downloads, according to the available data) and Abstracts Views on Vision4Press platform.
Data correspond to usage on the plateform after 2015. The current usage metrics is available 48-96 hours after online publication and is updated daily on week days.
Initial download of the metrics may take a while.


