Fig. B.3
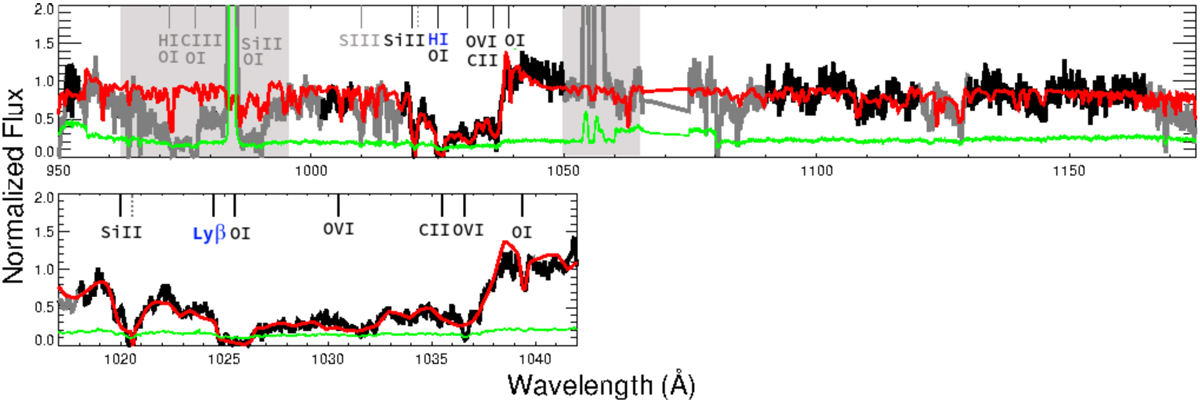
Fit (in red solid line) of the COS G130M spectrum of the galaxy J0921+4509. Black is the observed flux included in the routine either to fit the stellar continuum or the ISM absorption lines. Gray portions are masked out for both steps; gray shaded regions indicate those masked because of geocoronal emission. The flux error array appears in green. We display the ISM and Milky Way absorption lines as solid and dotted lines in the upper portion of each panel. Black or blue labels indicate that the lines are fit, whereas gray labels indicate that they are not fit. When present, red labels indicate lines that are not detected. Reference for this observation: Borthakur et al. (2014).
Current usage metrics show cumulative count of Article Views (full-text article views including HTML views, PDF and ePub downloads, according to the available data) and Abstracts Views on Vision4Press platform.
Data correspond to usage on the plateform after 2015. The current usage metrics is available 48-96 hours after online publication and is updated daily on week days.
Initial download of the metrics may take a while.