Fig. 2
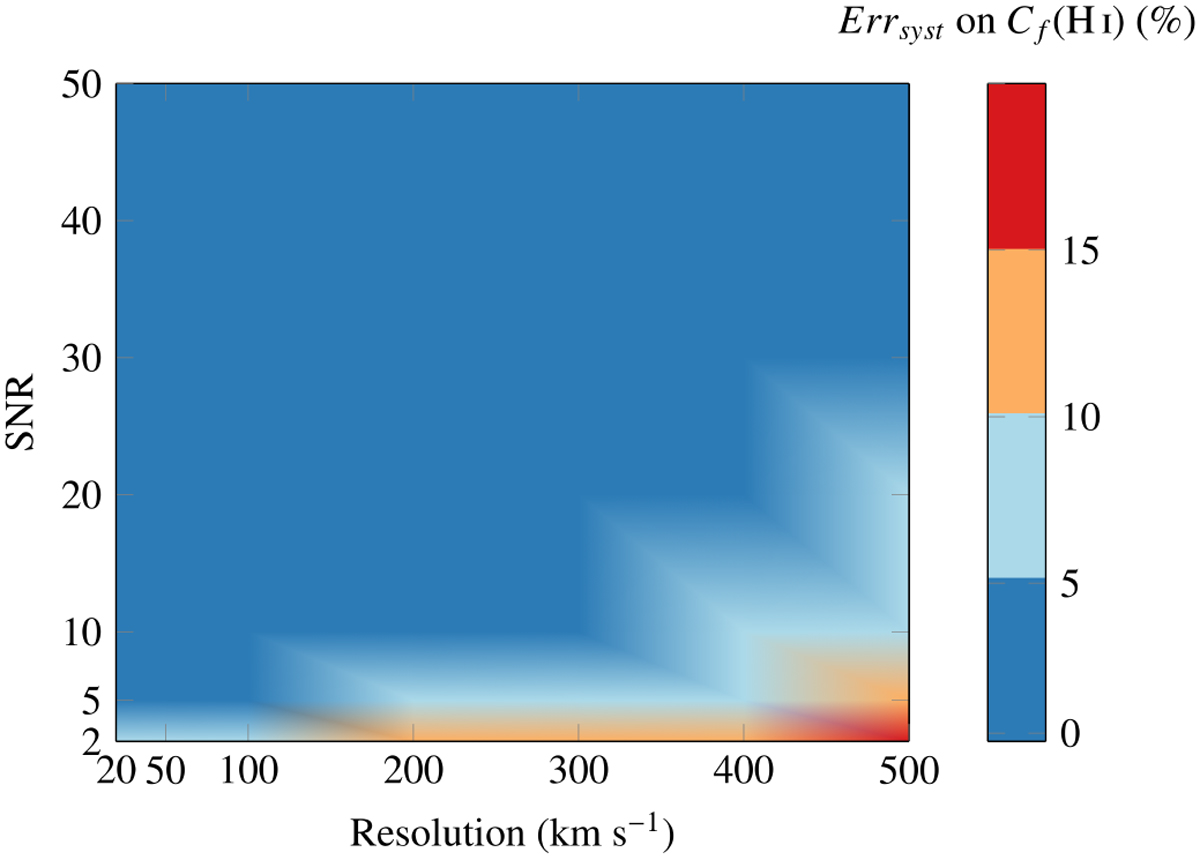
Color map of the systematic percent error of the covering fraction as a function of the resolution and S/N. The synthetic spectra are created with R < 120 km s−1 combine a theoretical stellar continuum spectra with R(S99) = 120 km s−1 and absorption lines of spectral resolution R. The covering fraction is recovered to within 5% of the estimated parameter for all observations within the dark blue region.
Current usage metrics show cumulative count of Article Views (full-text article views including HTML views, PDF and ePub downloads, according to the available data) and Abstracts Views on Vision4Press platform.
Data correspond to usage on the plateform after 2015. The current usage metrics is available 48-96 hours after online publication and is updated daily on week days.
Initial download of the metrics may take a while.