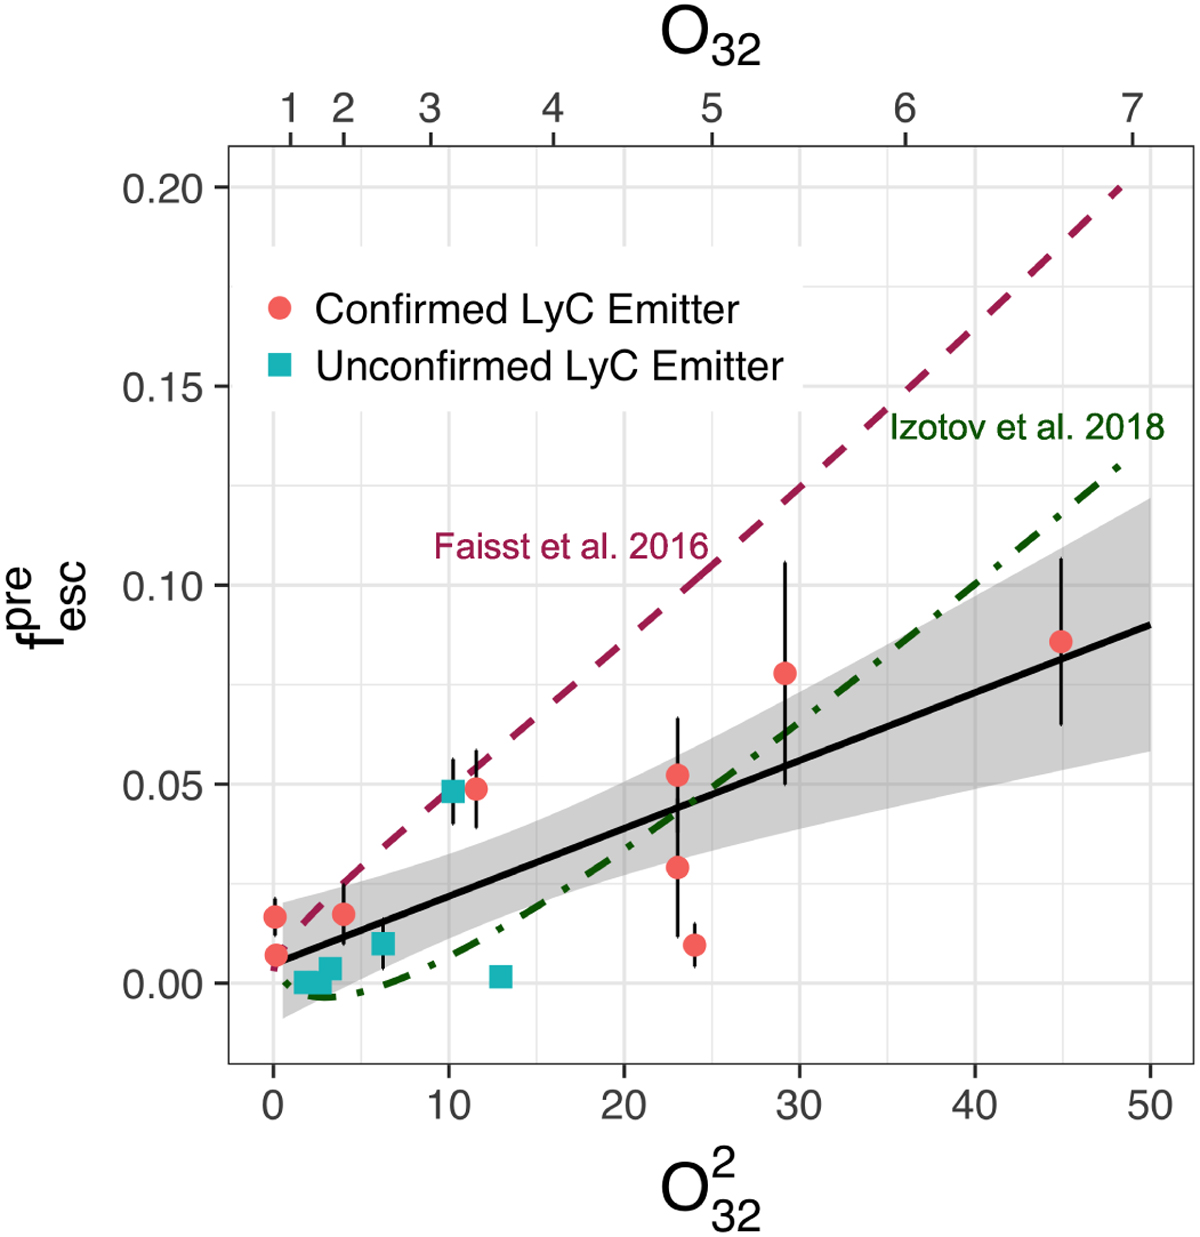
Fig. 4

Predicted Lyman continuum escape fraction (![]() ) from the Lyman series fits (Eq. (5)) vs. O
) from the Lyman series fits (Eq. (5)) vs. O![]() (O32 = [O III 5007 Å]/[O II 3727 Å]) for the full sample from Paper I. The upper x-axis shows the corresponding linear O32 values. Red circles and blue squares denote confirmed and unconfirmed (i.e., galaxies without LyC observations) LyC emitters, respectively. The correlation (Eq. (15)) has a 3σ significance (p-value < 0.001) and the 95% confidence interval is shown in gray. Overplotted as a maroon dashed line is the empirical relationship from Faisst (2016). The recent fit from Izotov et al. (2018) is also shown as the green dot-dashed line. The relationship derived here predicts lower fesc values at large O32 than the two other relationships.
(O32 = [O III 5007 Å]/[O II 3727 Å]) for the full sample from Paper I. The upper x-axis shows the corresponding linear O32 values. Red circles and blue squares denote confirmed and unconfirmed (i.e., galaxies without LyC observations) LyC emitters, respectively. The correlation (Eq. (15)) has a 3σ significance (p-value < 0.001) and the 95% confidence interval is shown in gray. Overplotted as a maroon dashed line is the empirical relationship from Faisst (2016). The recent fit from Izotov et al. (2018) is also shown as the green dot-dashed line. The relationship derived here predicts lower fesc values at large O32 than the two other relationships.
Current usage metrics show cumulative count of Article Views (full-text article views including HTML views, PDF and ePub downloads, according to the available data) and Abstracts Views on Vision4Press platform.
Data correspond to usage on the plateform after 2015. The current usage metrics is available 48-96 hours after online publication and is updated daily on week days.
Initial download of the metrics may take a while.


