Fig. 2
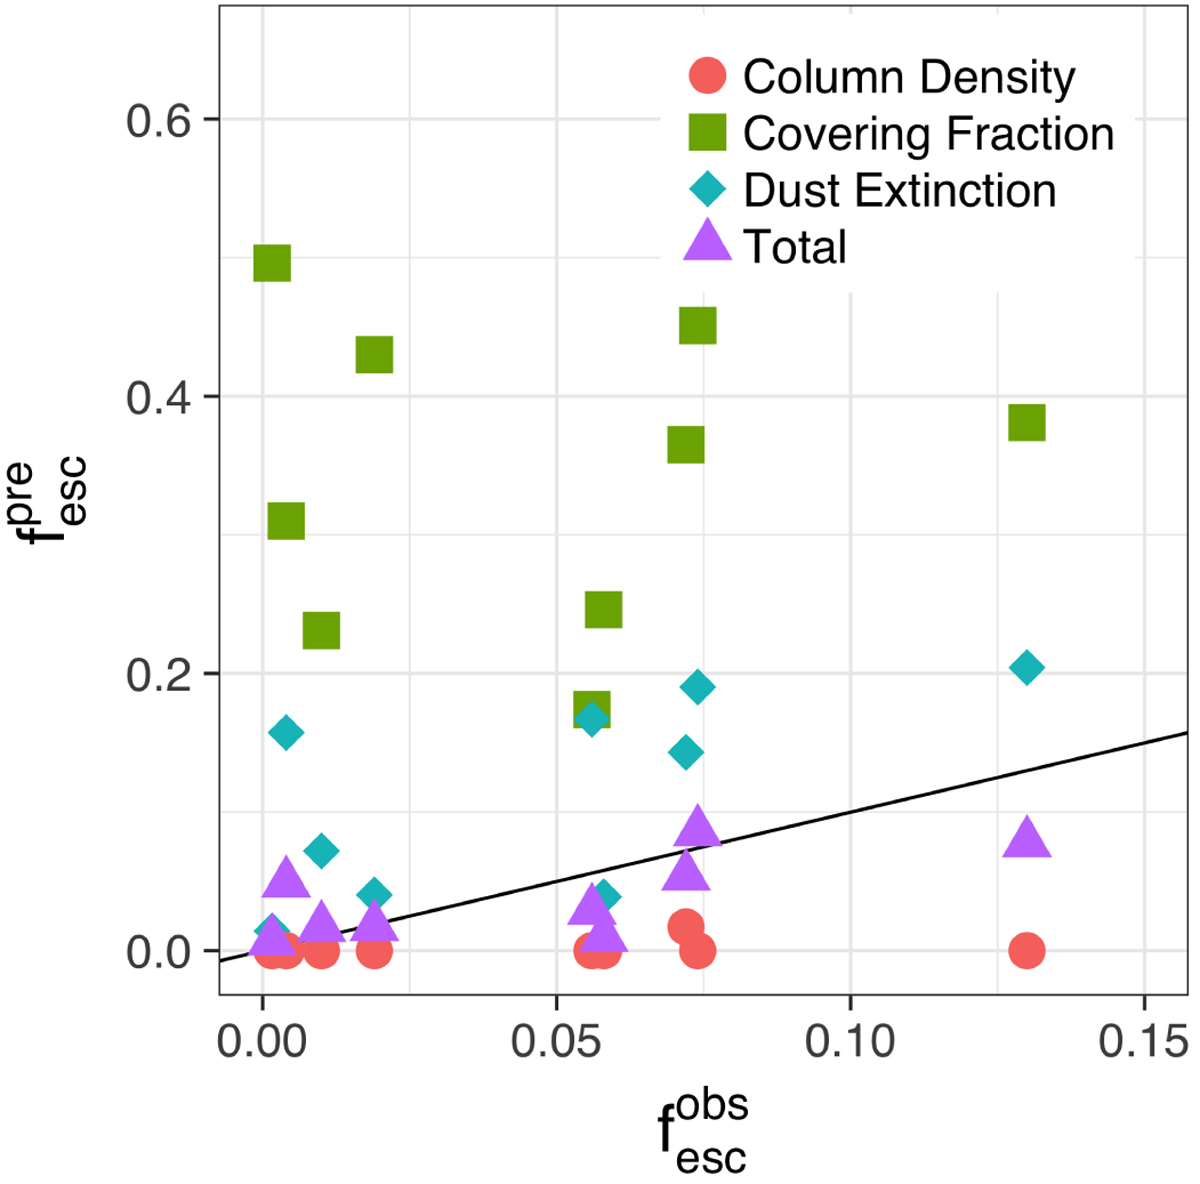
Observed Lyman continuum escape fraction (![]() ) vs. the Lyman continuum escape fractions predicted by isolating various fit parameters (
) vs. the Lyman continuum escape fractions predicted by isolating various fit parameters (![]() ). Each colored symbol represents the contribution of a single parameter from our model (Eq. (5)). The red circles correspond to the contribution to the escape fraction from the H I column density alone. The cyan diamonds correspond to the contribution from dust attenuation only. The green squares indicate the contribution to
). Each colored symbol represents the contribution of a single parameter from our model (Eq. (5)). The red circles correspond to the contribution to the escape fraction from the H I column density alone. The cyan diamonds correspond to the contribution from dust attenuation only. The green squares indicate the contribution to![]() from the H I covering fraction. The purple triangles show the combination of all three mechanisms that scatter about the one-to-one line. Dust and the H I covering fraction dominate
from the H I covering fraction. The purple triangles show the combination of all three mechanisms that scatter about the one-to-one line. Dust and the H I covering fraction dominate![]() .
.
Current usage metrics show cumulative count of Article Views (full-text article views including HTML views, PDF and ePub downloads, according to the available data) and Abstracts Views on Vision4Press platform.
Data correspond to usage on the plateform after 2015. The current usage metrics is available 48-96 hours after online publication and is updated daily on week days.
Initial download of the metrics may take a while.