Fig. 5.
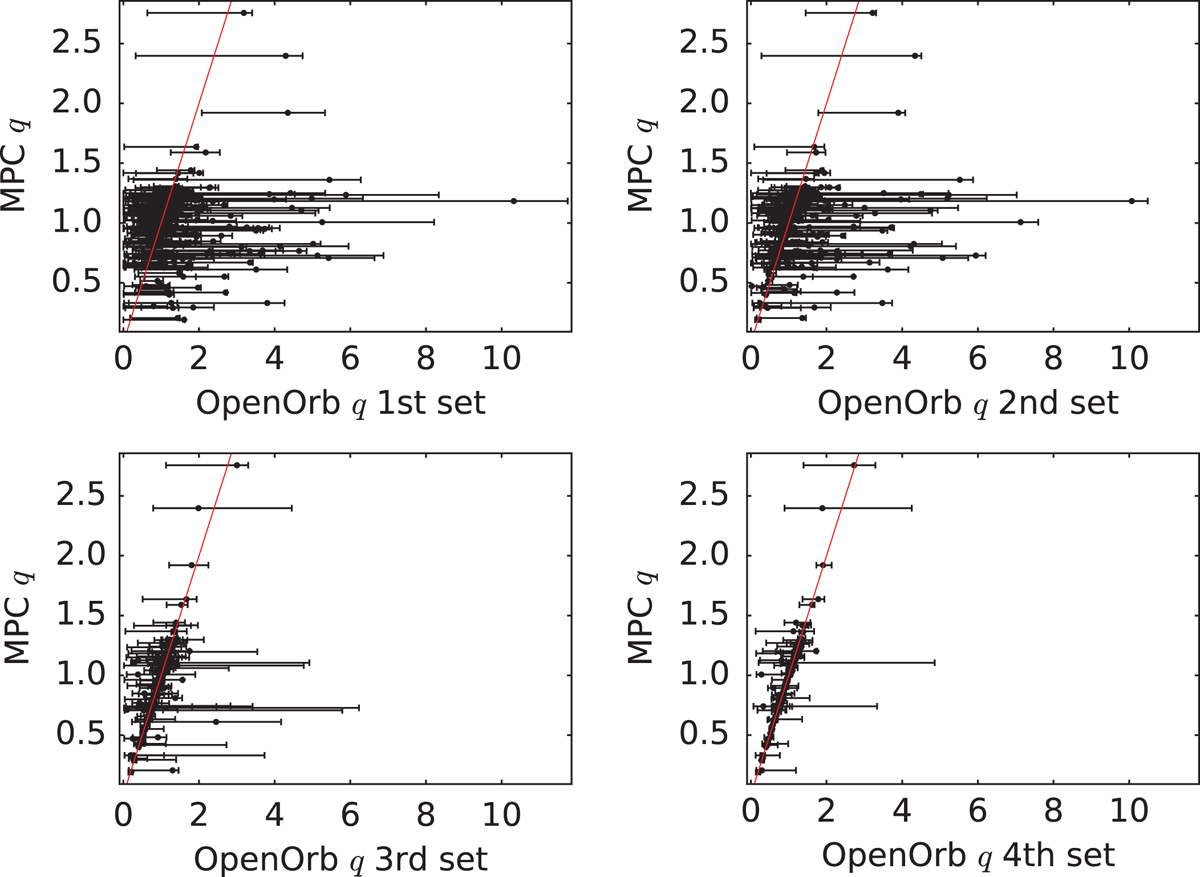
Perihelion distance as estimated by NEORANGER and by MPC. The MPC estimate is based on all available data whereas the neoranger estimate only includes parts of it as described below each plot. The solid red line is included for reference and corresponds to a 100% correlation between the perihelion distance as estimated by NEORANGER and by MPC.
Current usage metrics show cumulative count of Article Views (full-text article views including HTML views, PDF and ePub downloads, according to the available data) and Abstracts Views on Vision4Press platform.
Data correspond to usage on the plateform after 2015. The current usage metrics is available 48-96 hours after online publication and is updated daily on week days.
Initial download of the metrics may take a while.