Free Access
Fig. 4.
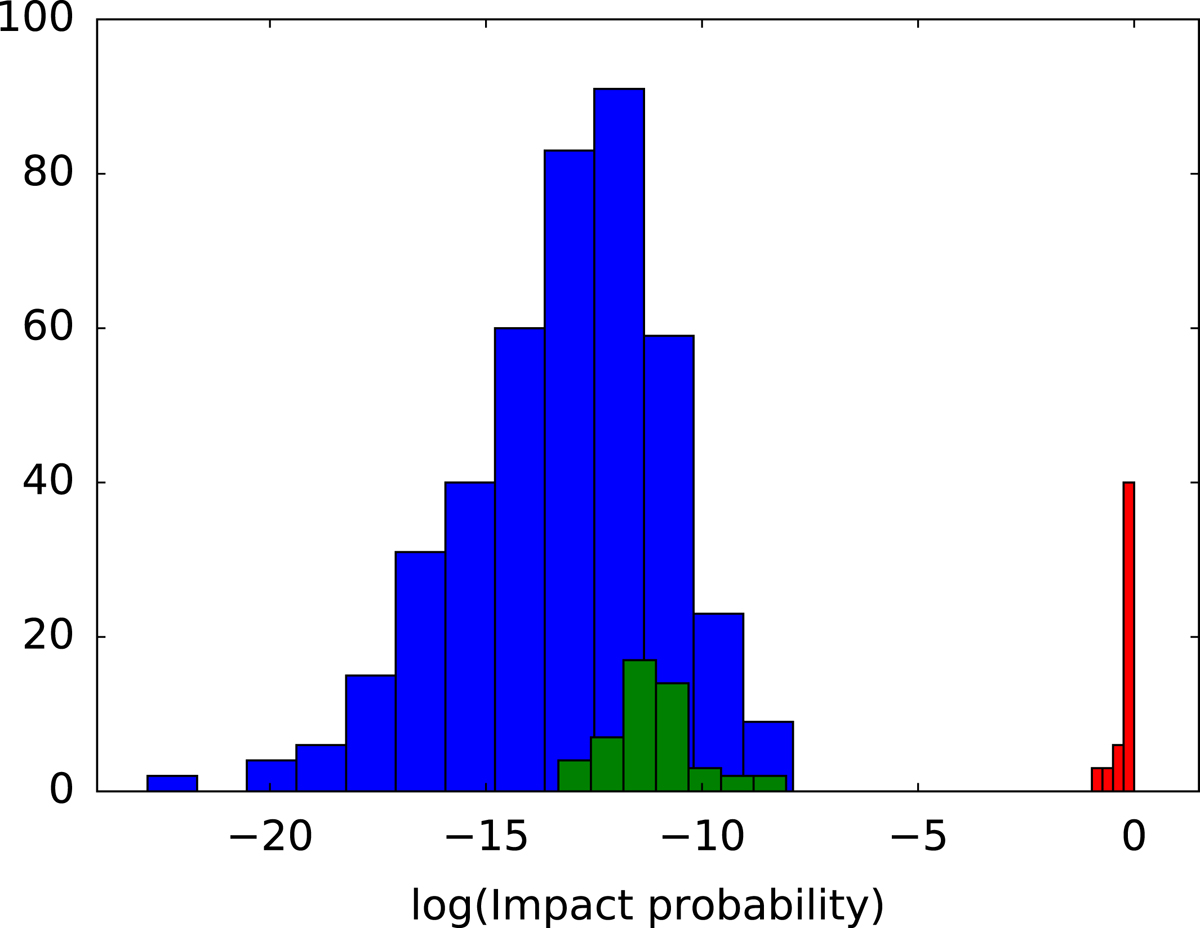
Impact probabilities for NEOCP objects during eight weeks of continuous monitoring (blue), for 50 simulated impactors using one observation set (green), and for 2008 TC3, 2014 AA, and 50 simulated impactors using two observation sets from consecutive nights (red).
Current usage metrics show cumulative count of Article Views (full-text article views including HTML views, PDF and ePub downloads, according to the available data) and Abstracts Views on Vision4Press platform.
Data correspond to usage on the plateform after 2015. The current usage metrics is available 48-96 hours after online publication and is updated daily on week days.
Initial download of the metrics may take a while.