Fig. 6
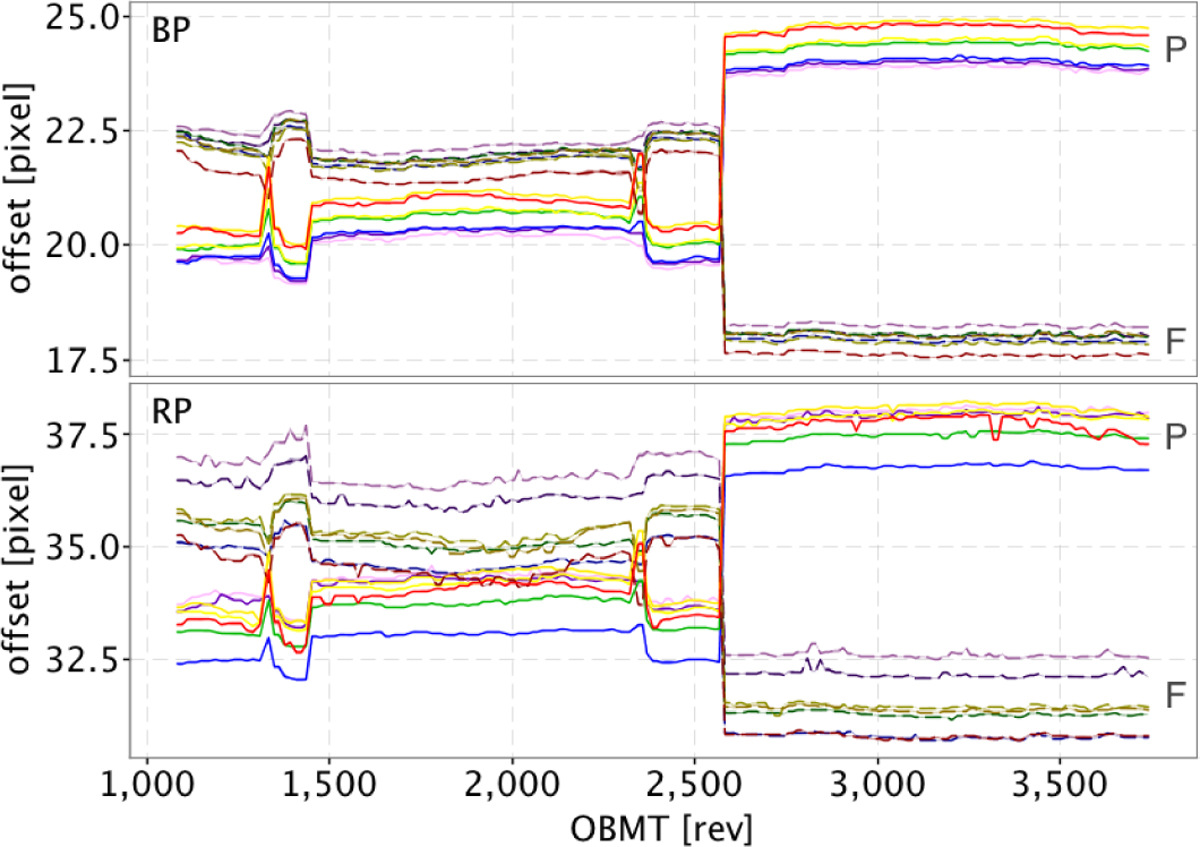
Evolution in time of the geometric calibration, relative to the nominal geometry, evaluated at the centre of the CCD in the across-scan direction and for different CCDs (BP in the top panel, RP in the bottom panel; rows from 1 to 7 are shown in red, orange, yellow, green, blue, purple, and pink). The preceding FoV is shown with brighter colours and solid lines, while darker shades and dashed lines are used for the following FoV, as indicated by the labels P and F in the plot area.
Current usage metrics show cumulative count of Article Views (full-text article views including HTML views, PDF and ePub downloads, according to the available data) and Abstracts Views on Vision4Press platform.
Data correspond to usage on the plateform after 2015. The current usage metrics is available 48-96 hours after online publication and is updated daily on week days.
Initial download of the metrics may take a while.