Fig. 22.
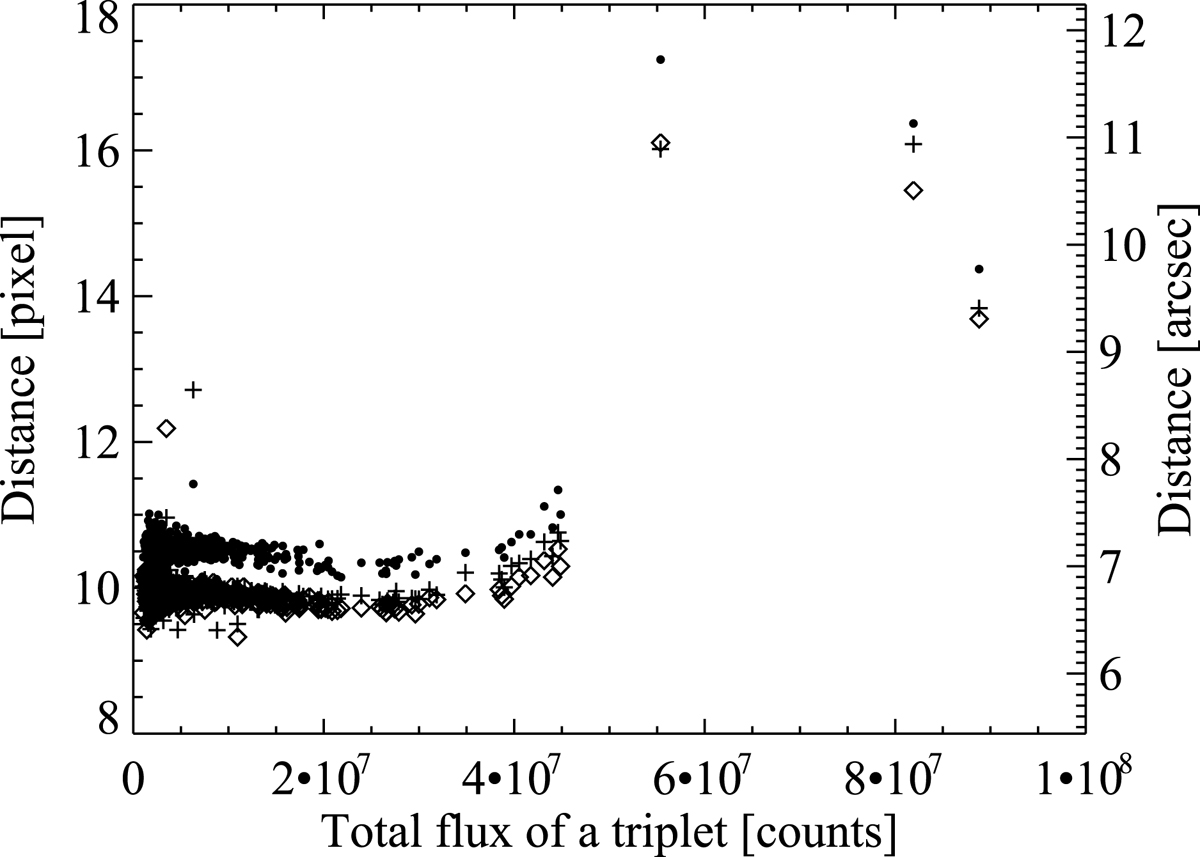
Adjacency effect on the triple-exposure plate #854. For each star image of a triplet, forming a triangle, the distance of the star from the center of mass of the triangle is plotted as a function of the total flux of the triplet. The stars at the different corners of the triangle are plotted with a different symbol (plus sign, square, circle).
Current usage metrics show cumulative count of Article Views (full-text article views including HTML views, PDF and ePub downloads, according to the available data) and Abstracts Views on Vision4Press platform.
Data correspond to usage on the plateform after 2015. The current usage metrics is available 48-96 hours after online publication and is updated daily on week days.
Initial download of the metrics may take a while.