Fig. 16.
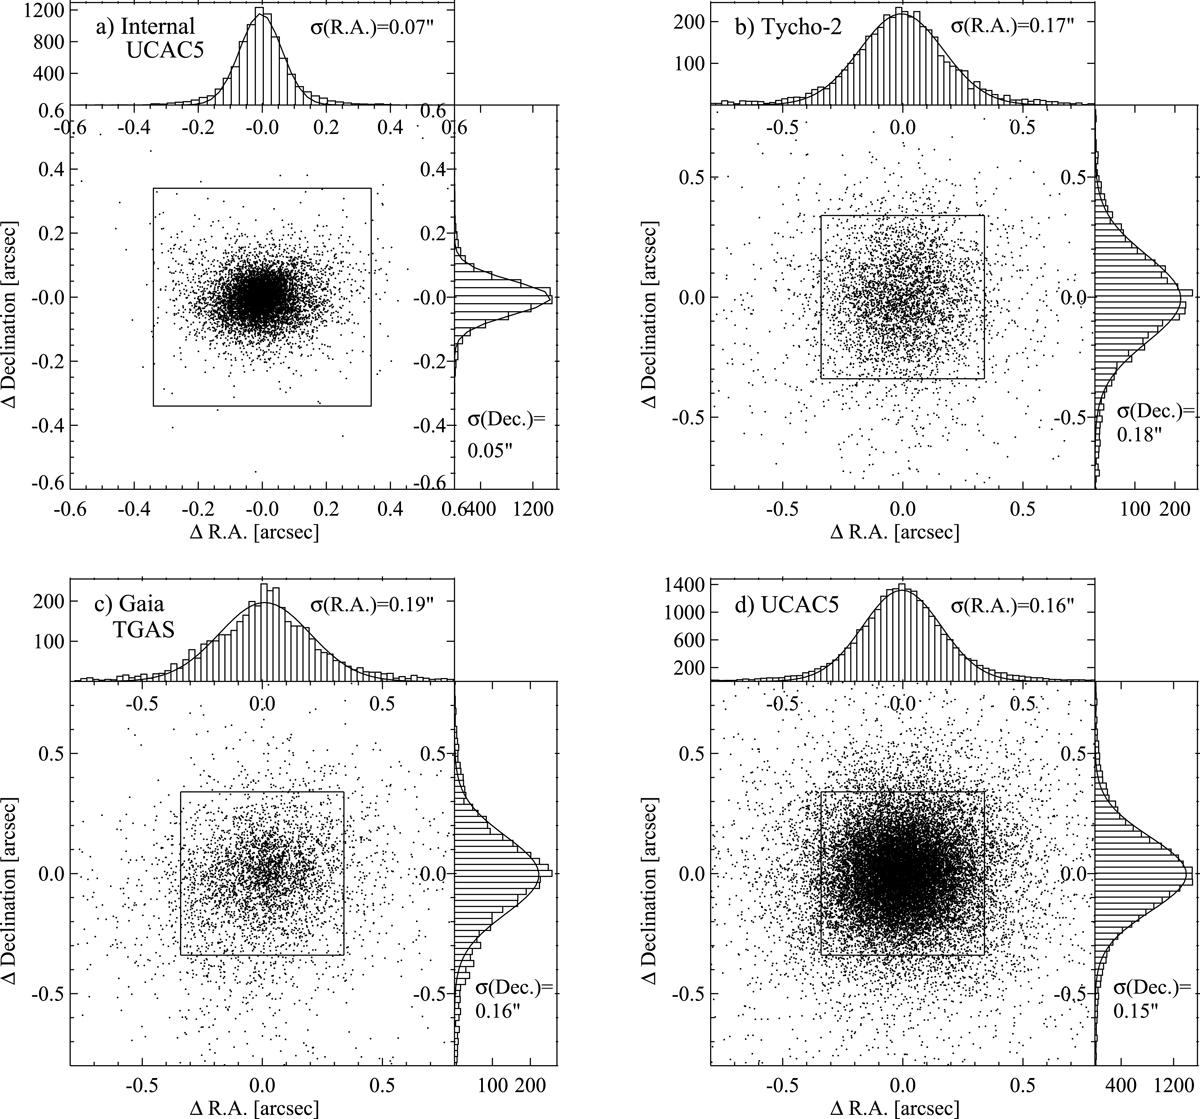
Astrometric results for the single-exposure plates. Panel a: the differences between the coordinates of the UCAC5 stars in the overlapping images at the epoch of each plate. Panels b–d: the differences between the coordinates of all the stars in the plates and the coordinates of the corresponding stars in the Tycho-2, Gaia TGAS, and UCAC5 catalog, respectively, at the epoch of each plate. In all the panels, the size of an image pixel is shown as a box, Gaussian fits are plotted over the histograms, and the Gaussian standard deviations are given.
Current usage metrics show cumulative count of Article Views (full-text article views including HTML views, PDF and ePub downloads, according to the available data) and Abstracts Views on Vision4Press platform.
Data correspond to usage on the plateform after 2015. The current usage metrics is available 48-96 hours after online publication and is updated daily on week days.
Initial download of the metrics may take a while.