Free Access
Fig. 15.
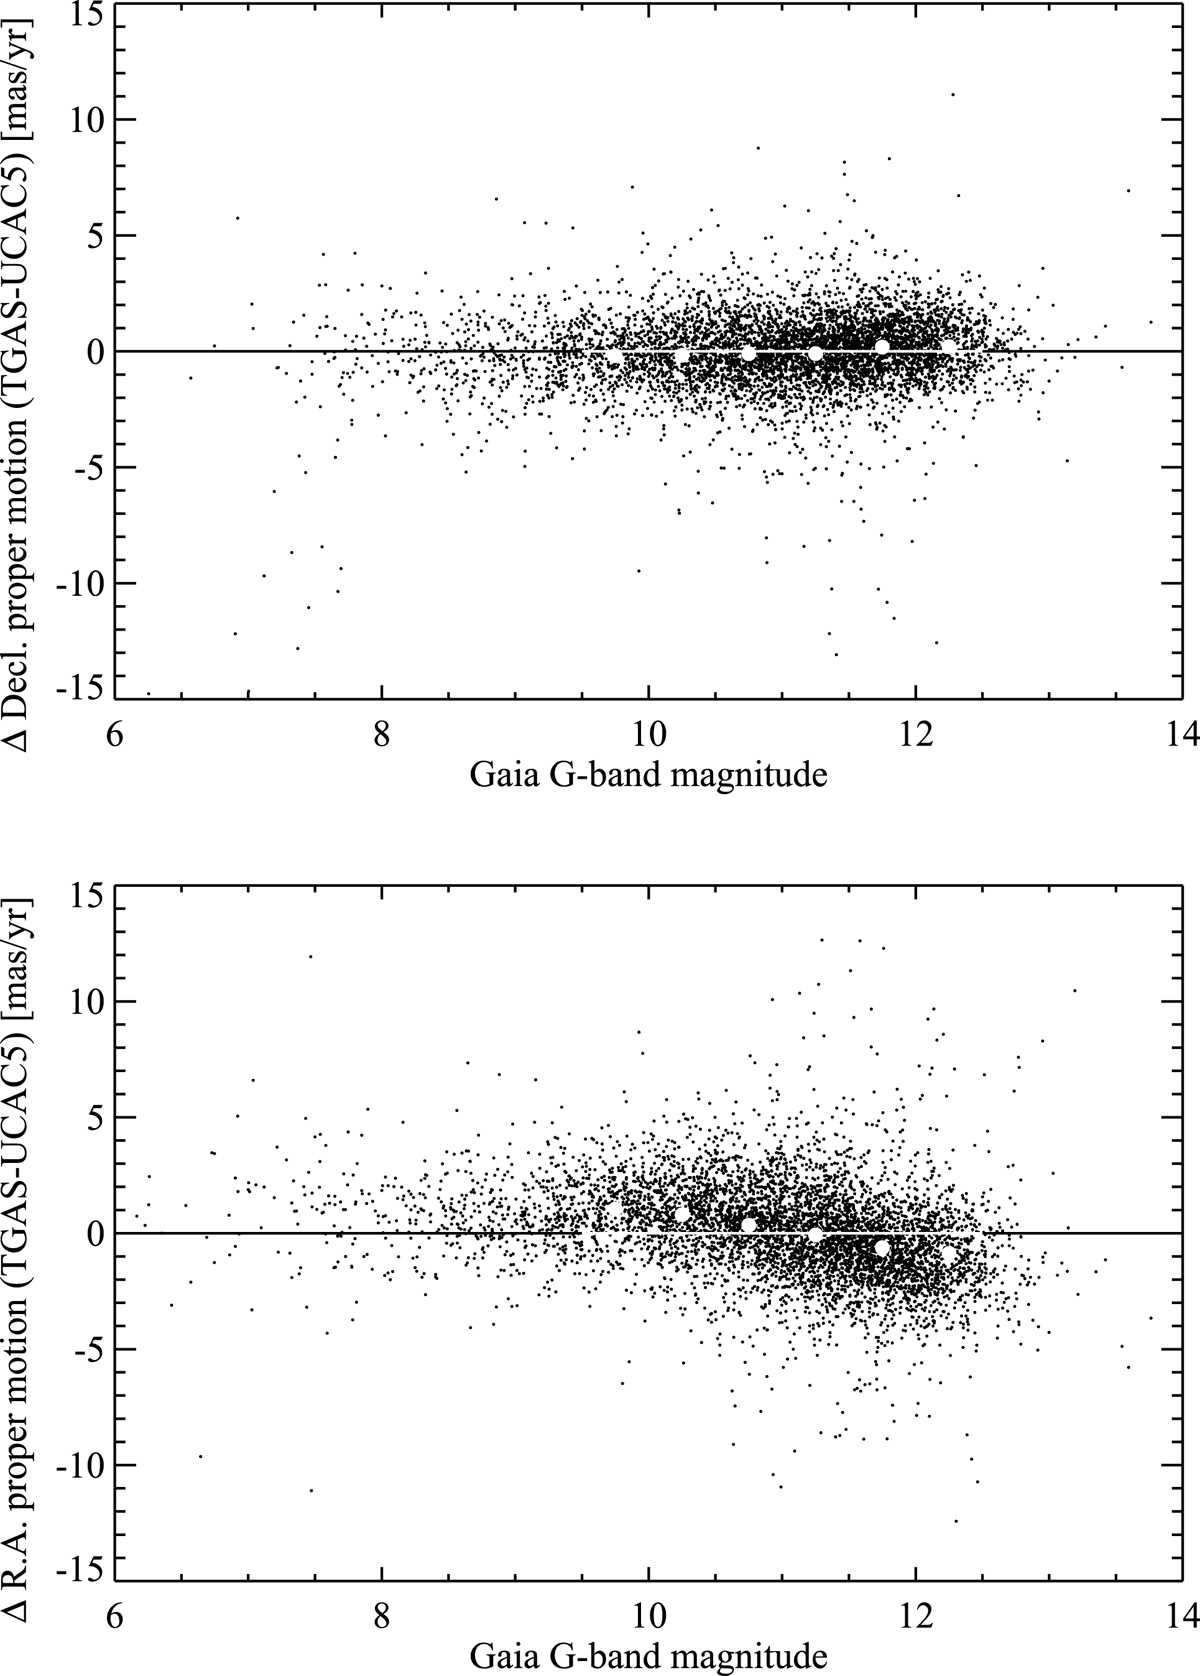
Differences of the proper motions given in the Gaia TGAS and UCAC5 catalogs as a function of magnitude for the stars within our plates. Mean values over 0.5 magnitude bins are shown as white dots. The lower panel is for RA, the upper panel is for declination.
Current usage metrics show cumulative count of Article Views (full-text article views including HTML views, PDF and ePub downloads, according to the available data) and Abstracts Views on Vision4Press platform.
Data correspond to usage on the plateform after 2015. The current usage metrics is available 48-96 hours after online publication and is updated daily on week days.
Initial download of the metrics may take a while.