Fig. 1.
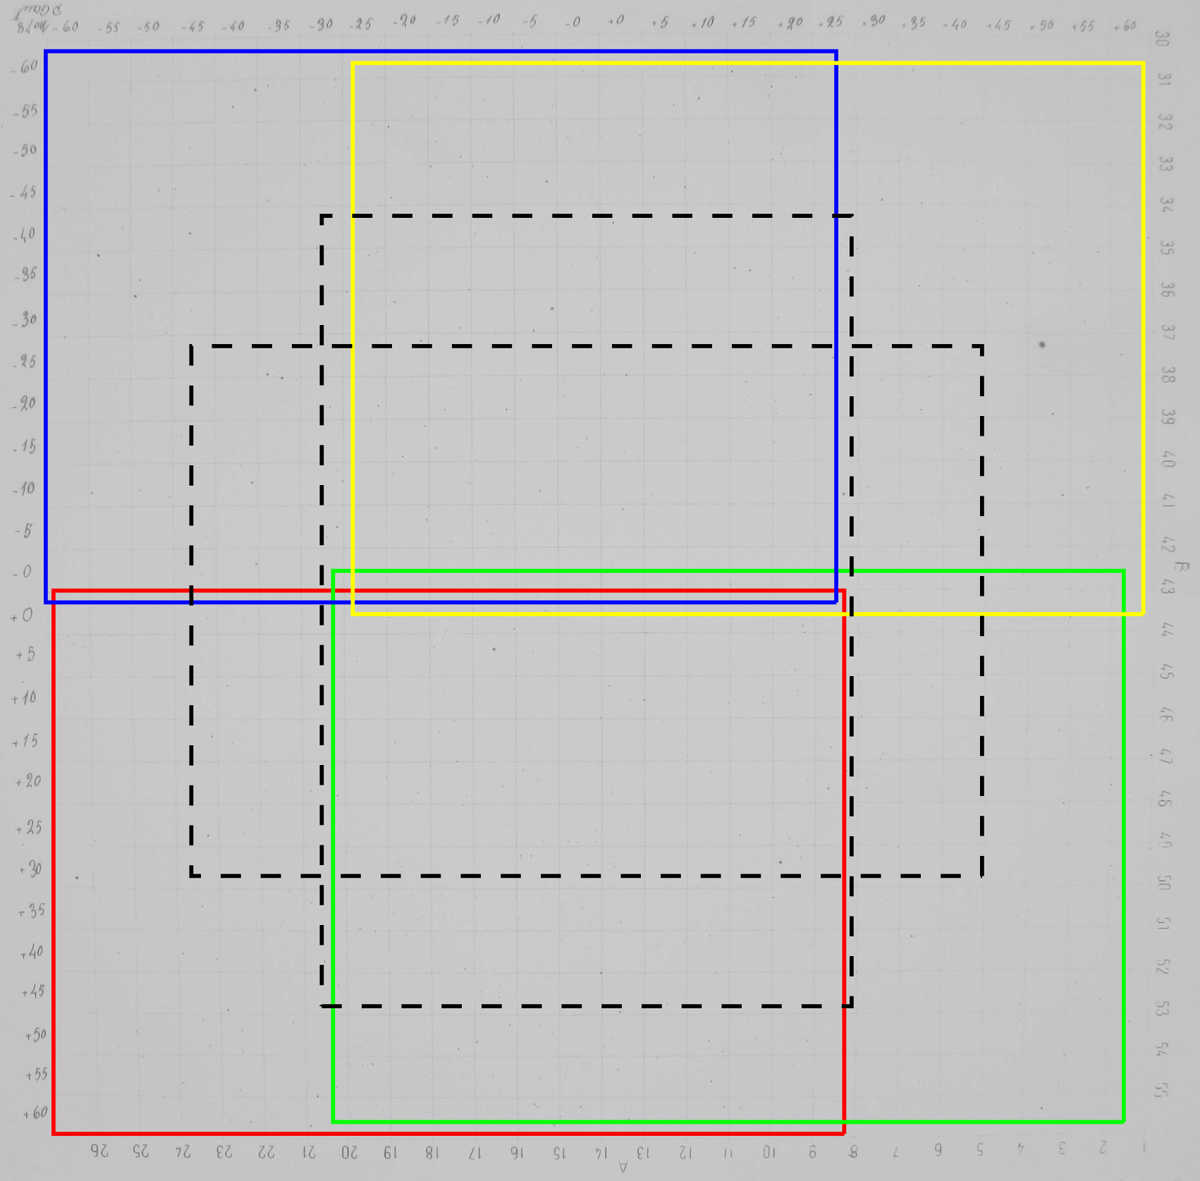
Schematic view of the two methods used to digitize each plate. The four colored rectangles show the overlapping images that cover the whole plate. The two rectangles with dashed lines show the overlapping images that exclude the borders of the plate. The images taken with the former method are used in our final data analysis.
Current usage metrics show cumulative count of Article Views (full-text article views including HTML views, PDF and ePub downloads, according to the available data) and Abstracts Views on Vision4Press platform.
Data correspond to usage on the plateform after 2015. The current usage metrics is available 48-96 hours after online publication and is updated daily on week days.
Initial download of the metrics may take a while.