Fig. 7.
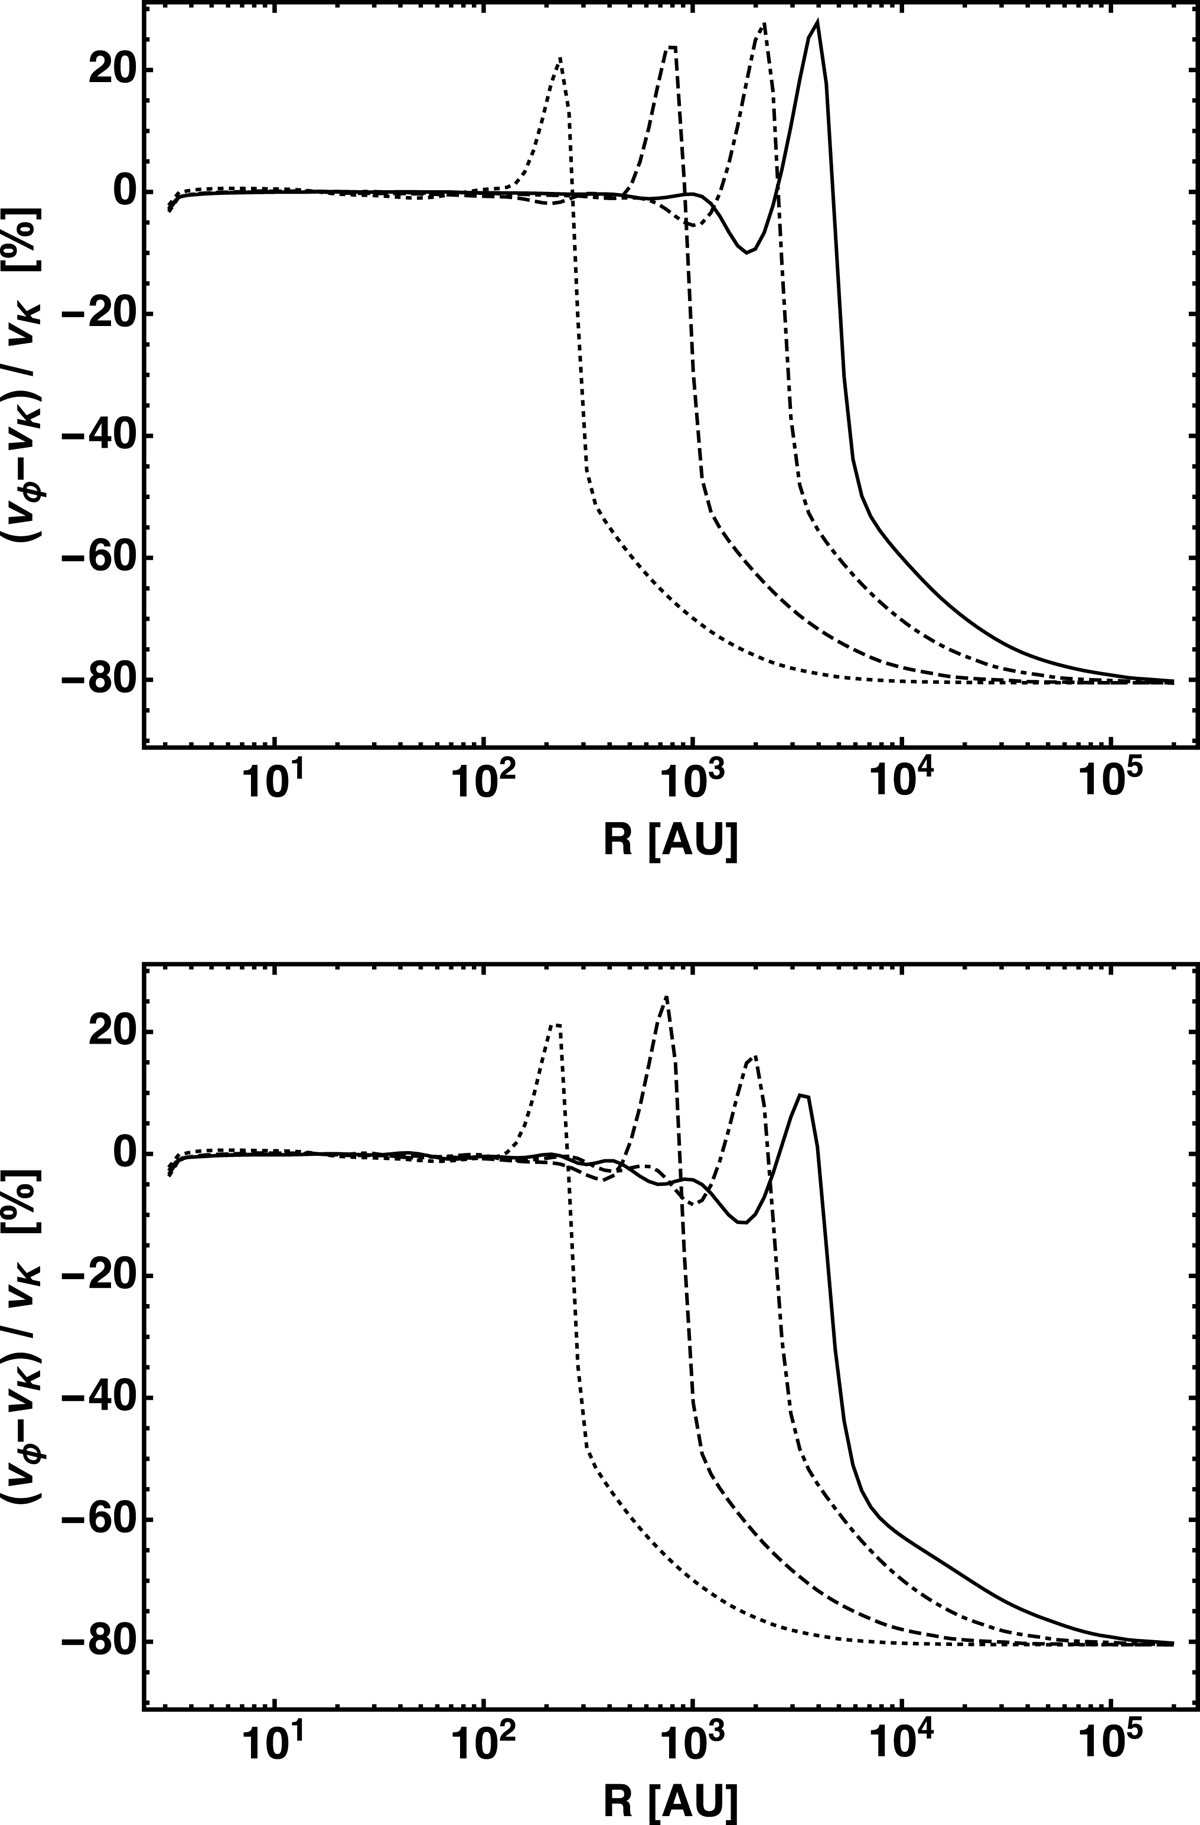
Visualization of disk formation: deviation from gravito-centrifugal equilibrium of the midplane gas as function of radius for four different snapshots in time. Dotted, dashed, dot-dashed, and solid lines corresponds to t = 5, 15, 40, and 80 kyr of evolution, respectively. The bottom panel refers to the simulation including all feedback components, radiation forces are neglected in the simulation data of the upper panel. Outflows and photoionization is accounted for in both simulations shown, both panels present the data from the large-scale mass reservoir simulations.
Current usage metrics show cumulative count of Article Views (full-text article views including HTML views, PDF and ePub downloads, according to the available data) and Abstracts Views on Vision4Press platform.
Data correspond to usage on the plateform after 2015. The current usage metrics is available 48-96 hours after online publication and is updated daily on week days.
Initial download of the metrics may take a while.