Fig. 5.
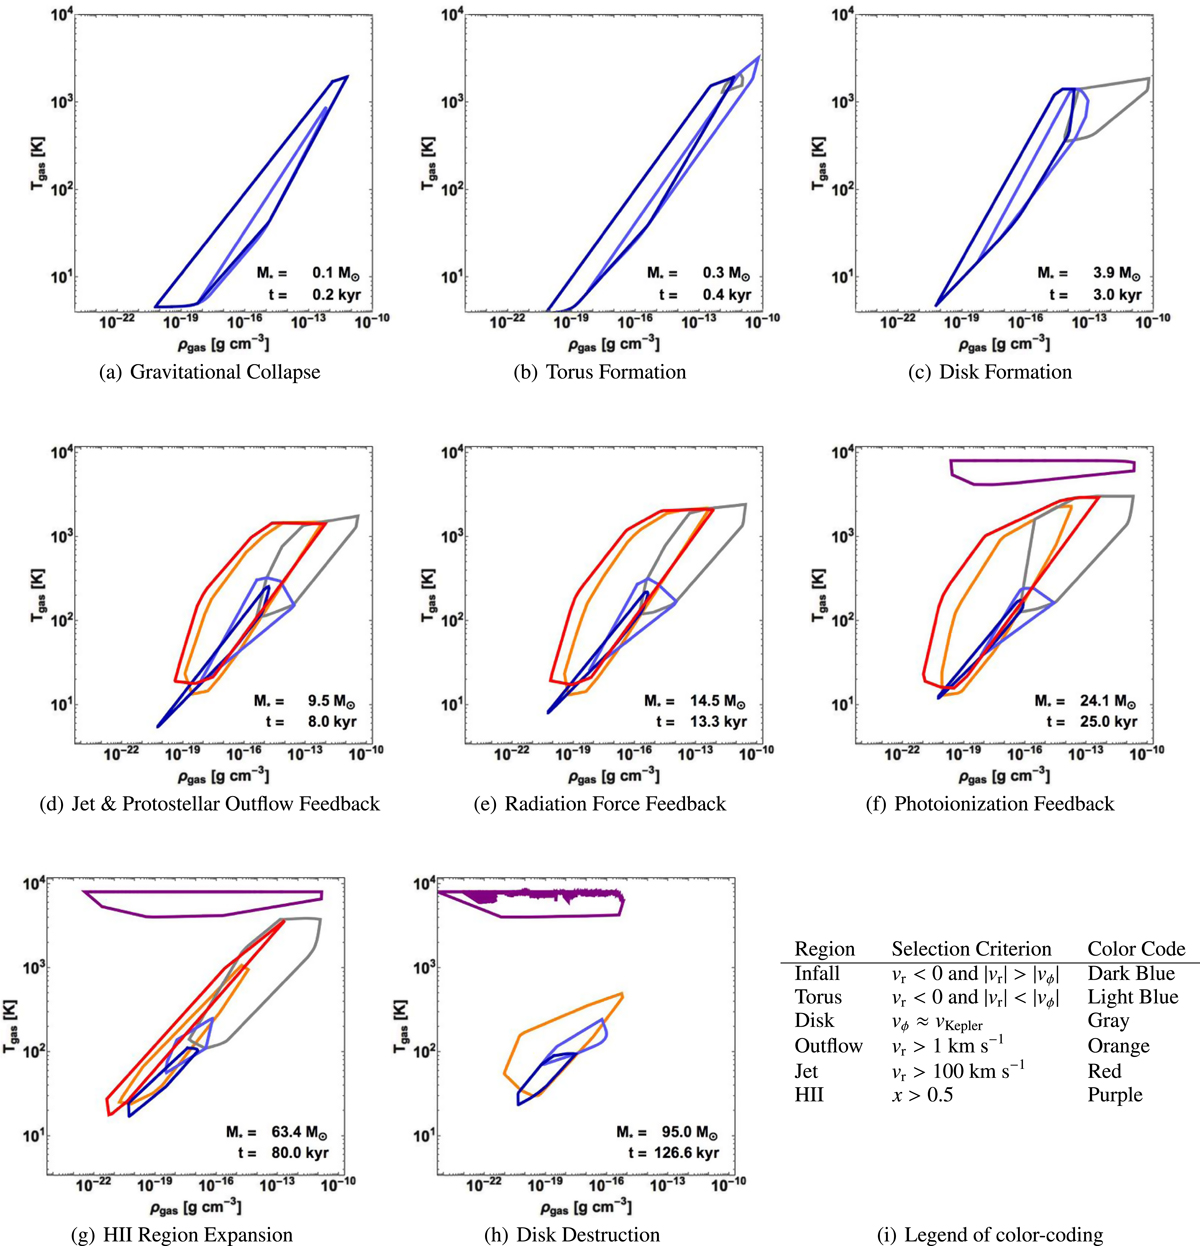
Phase diagrams (gas temperature–gas density plane) for the different epochs of the evolution of the stellar surrounding. The time after the onset of the initial global gravitational collapse and the current mass of the (proto)star is given at the bottom right corner of each panel, the associated label is given in the sub-caption. Data is taken from the fiducial case “1.0pc-PO-RAD-ION”.
Current usage metrics show cumulative count of Article Views (full-text article views including HTML views, PDF and ePub downloads, according to the available data) and Abstracts Views on Vision4Press platform.
Data correspond to usage on the plateform after 2015. The current usage metrics is available 48-96 hours after online publication and is updated daily on week days.
Initial download of the metrics may take a while.