Fig. 12.
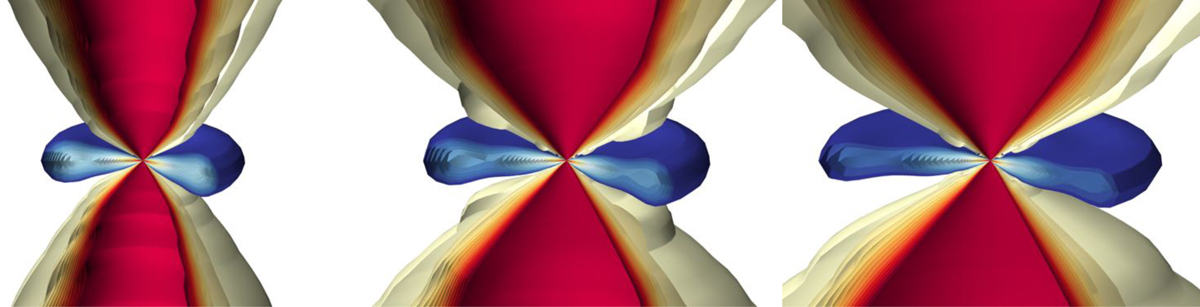
Scissor handle like push effect of the expanding HII region. From left to right: accretion disk and protostellar outflow at t = 20, 30, and 40 kyr of evolution. The disk density is color-coded as in Fig. 1. The outflow velocity is color-coded as in Fig. 3. The images cover ≈5000 au in width. The outermost velocity iso-contour at each time resembles the extent of the HII region in the polar direction.
Current usage metrics show cumulative count of Article Views (full-text article views including HTML views, PDF and ePub downloads, according to the available data) and Abstracts Views on Vision4Press platform.
Data correspond to usage on the plateform after 2015. The current usage metrics is available 48-96 hours after online publication and is updated daily on week days.
Initial download of the metrics may take a while.