Free Access
Fig. 7
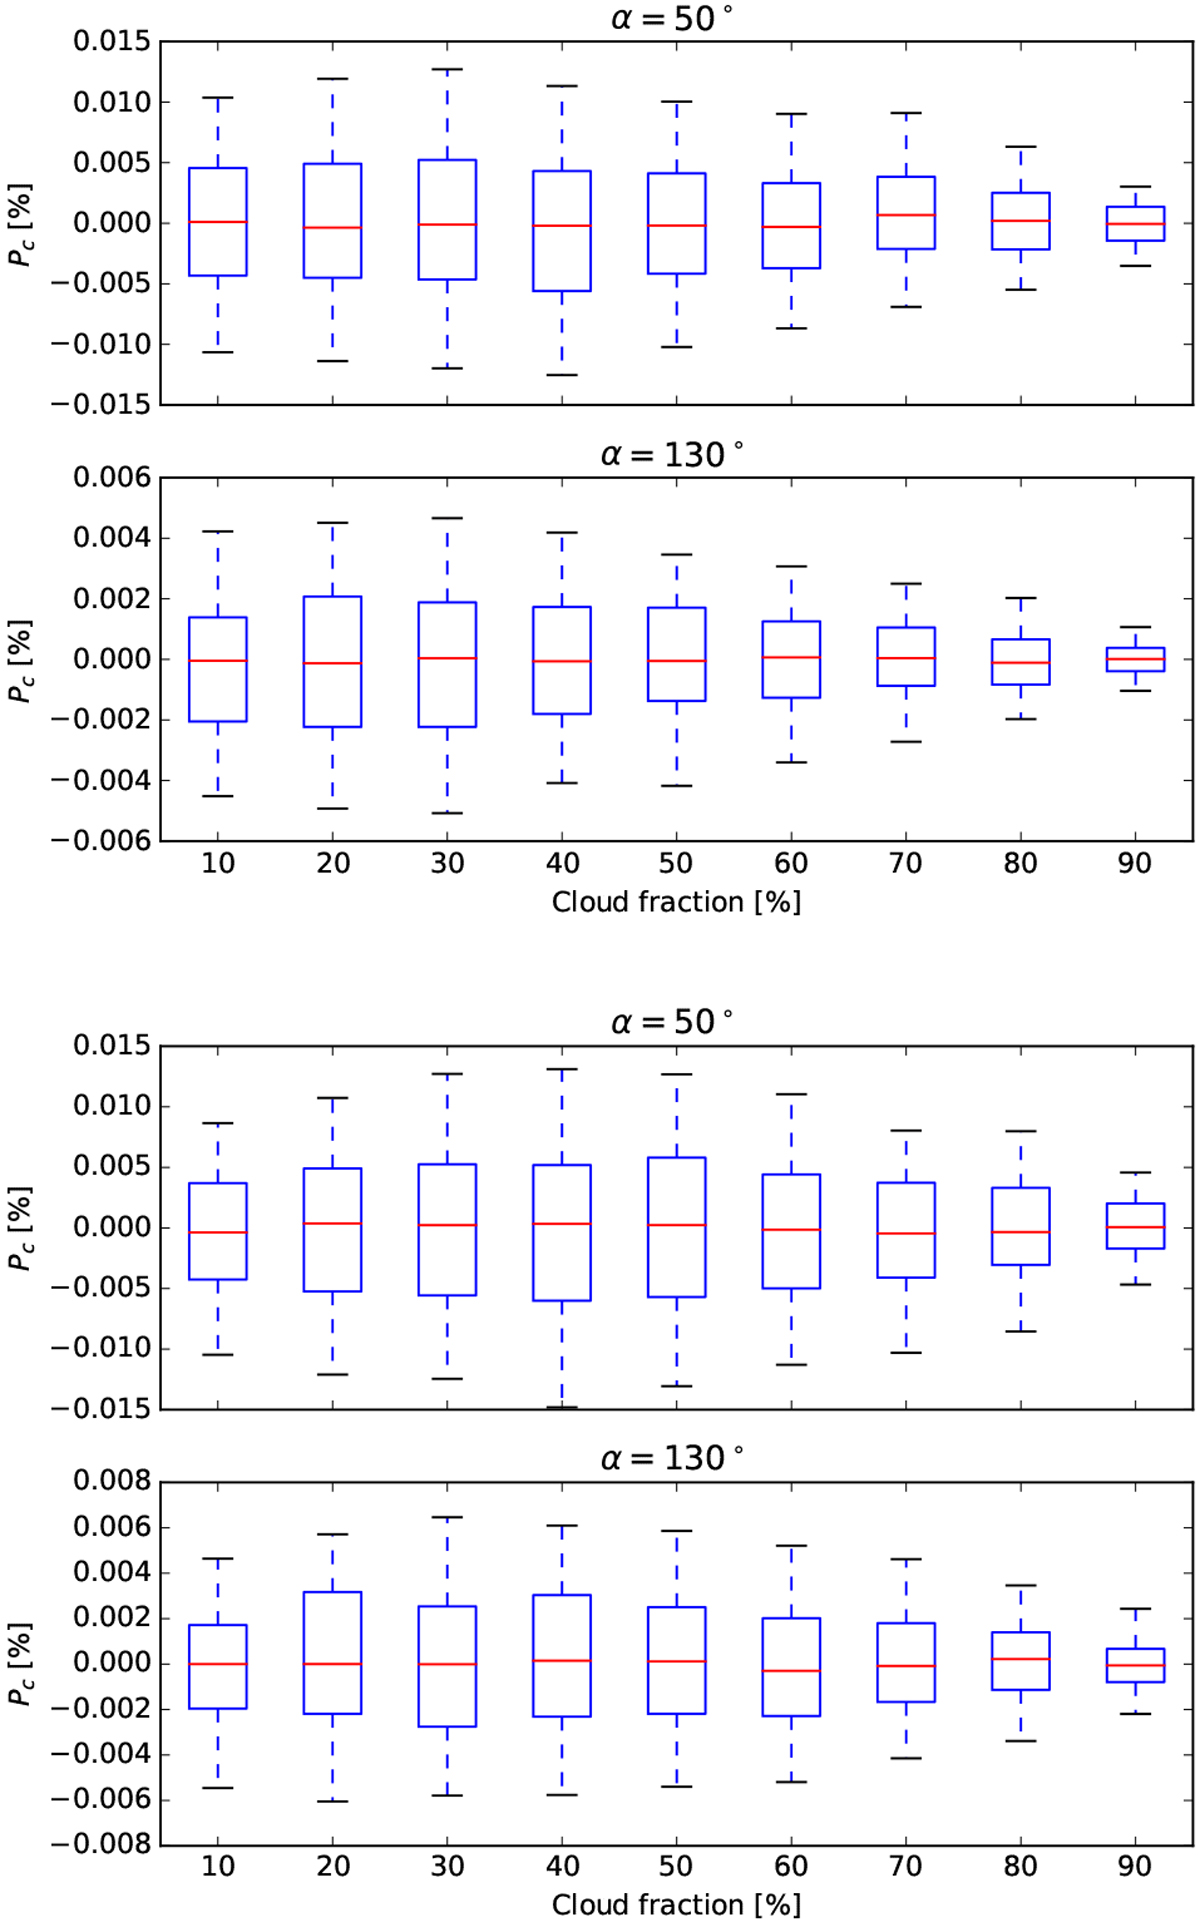
Box-plots of the distribution of Pc over 300 cloud patterns, for α = 50° and 130°, and the Earth-like (top) and Venus-like (bottom) cloud particles. The box indicates the first and third quartiles, with the median in red. The whiskers show the fifth and 95th percentiles.
Current usage metrics show cumulative count of Article Views (full-text article views including HTML views, PDF and ePub downloads, according to the available data) and Abstracts Views on Vision4Press platform.
Data correspond to usage on the plateform after 2015. The current usage metrics is available 48-96 hours after online publication and is updated daily on week days.
Initial download of the metrics may take a while.