Fig. 5.
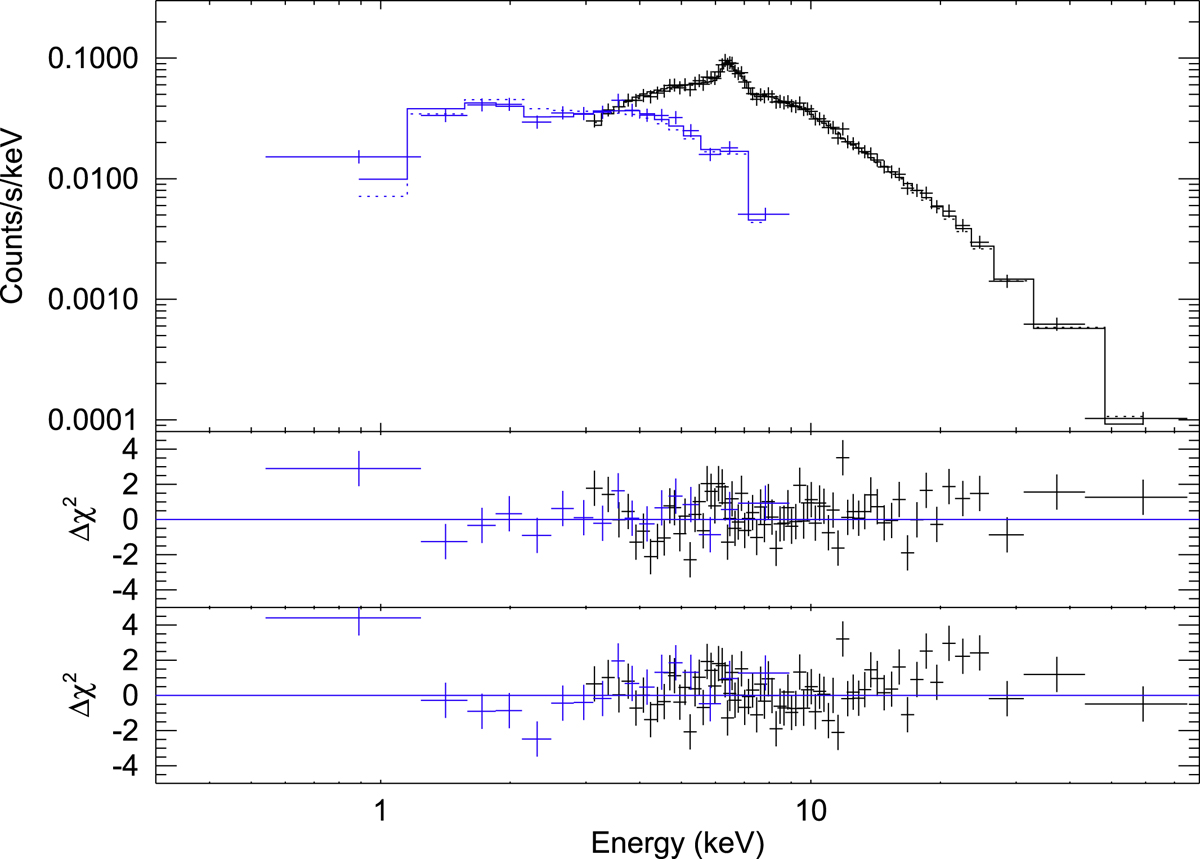
Top: NuSTAR (black) + Swift (blue) data and best spectral model (solid lines), which consists of a variable abundance, isobaric cooling flow modified by a complex absorber and reflection (see Table 1 for resulting parameters). Middle and bottom panels show the fit residuals in units of ![]() for the model with and without reflection, respectively.
for the model with and without reflection, respectively.
Current usage metrics show cumulative count of Article Views (full-text article views including HTML views, PDF and ePub downloads, according to the available data) and Abstracts Views on Vision4Press platform.
Data correspond to usage on the plateform after 2015. The current usage metrics is available 48-96 hours after online publication and is updated daily on week days.
Initial download of the metrics may take a while.