Fig. 6
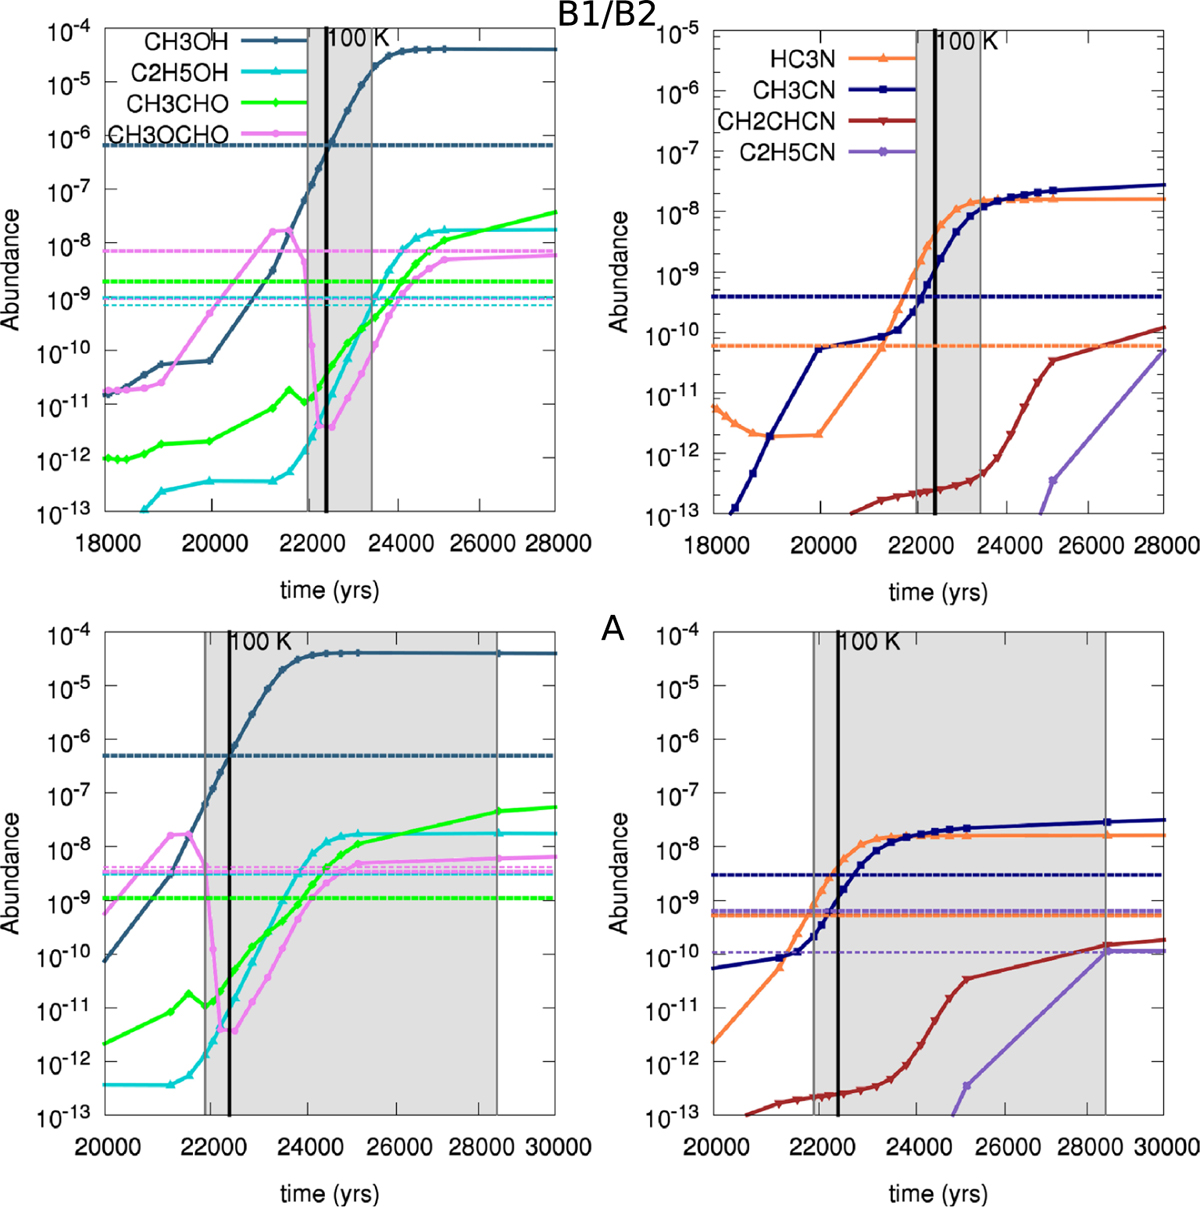
Best fit models of abundances vs. H2 for CH3 OH, C2 H5OH, CH3 CHO, CH3 OCHO, HC3 N, CH3 CN, CH2 CHCN, and C2 H5CN using IC 5. G35.20 B1/B2 (top) is best fit by the fast model with a gas density of 108 cm−3 over a time period of 1.3 kyr. G35.20 A (bottom) is also best fit by the fast model with a gas density of 108 cm−3 over a time period of 6.4 kyr. The line colors for A are the same as B1/B2 as shown in the key. All species are shown in the key with color-coded dashed horizontal lines showing the observed abundances for the source. The thinner dashed lines indicate the upper limit and lower limit species that best constrain the time span. The time ranges in which all abundances can be reproduced within the errors reported in Appendix B are shaded. We truncate the x-axis scale to better highlight the chemistry changes over the temperature range at which the COMs are released from the ice mantles.
Current usage metrics show cumulative count of Article Views (full-text article views including HTML views, PDF and ePub downloads, according to the available data) and Abstracts Views on Vision4Press platform.
Data correspond to usage on the plateform after 2015. The current usage metrics is available 48-96 hours after online publication and is updated daily on week days.
Initial download of the metrics may take a while.