Fig. 1
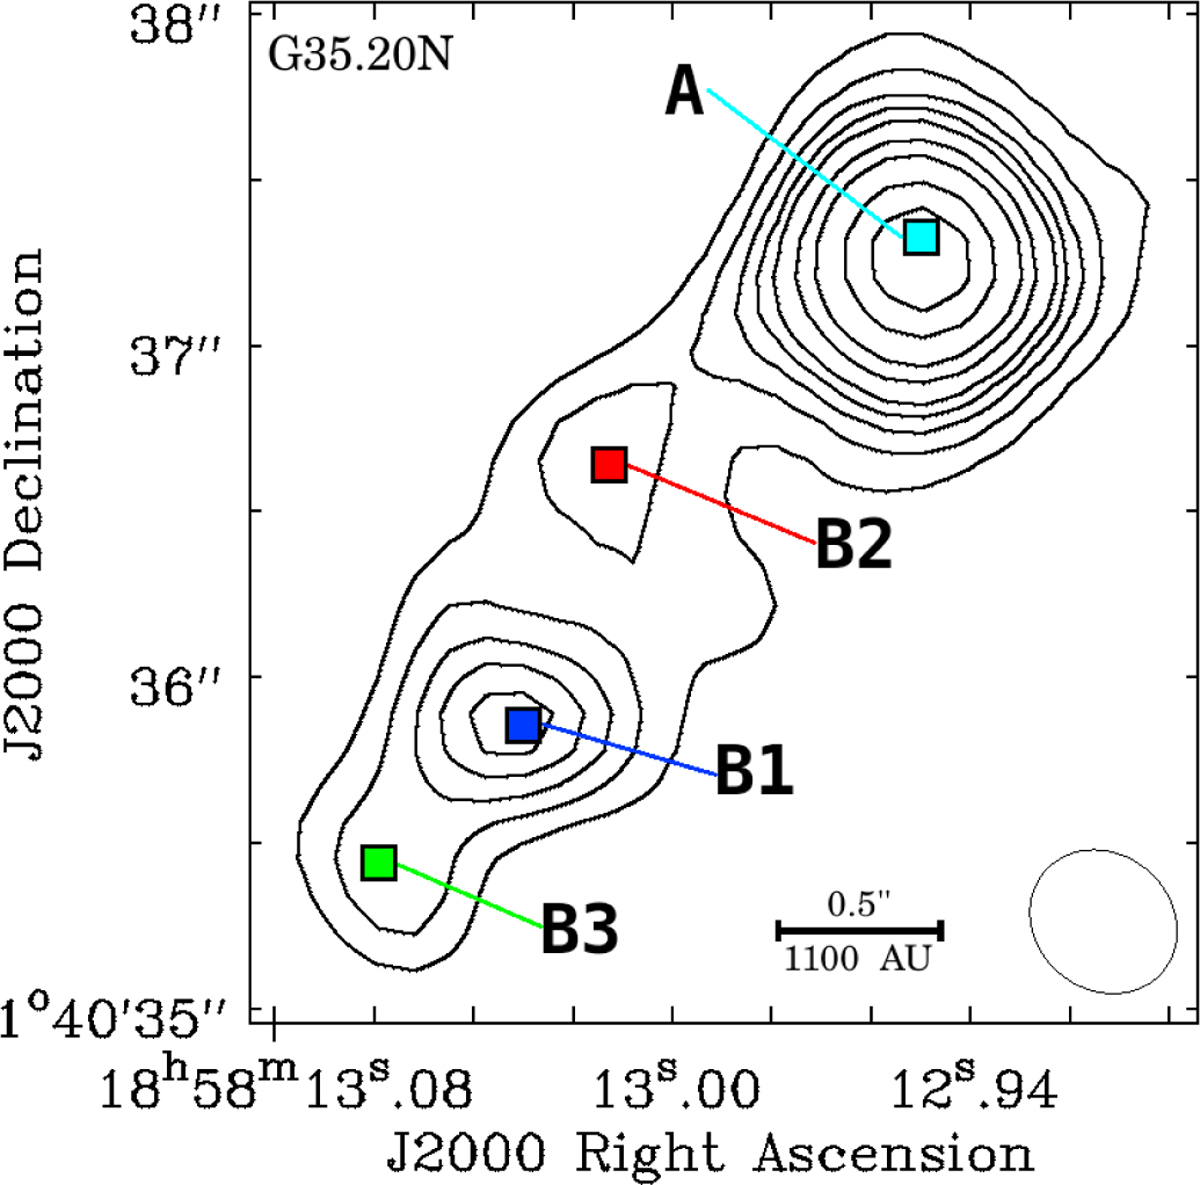
870 μm continuum emission from Cycle 0 ALMA observations of G35.20. The continuum peaks are labeled in order of intensity (i.e., peak B1 has the highest and peak B3 the lowest continuum intensity). Contour levels are 0.03, 0.042, 0.055, 0.067, 0.08, 0.10, 0.13, 0.18, and 0.23 Jy beam−1 (σ = 1.8 mJy beam−1). The pixel-sized colored squares denote each of the spectral extraction points (from Allen et al. 2017).
Current usage metrics show cumulative count of Article Views (full-text article views including HTML views, PDF and ePub downloads, according to the available data) and Abstracts Views on Vision4Press platform.
Data correspond to usage on the plateform after 2015. The current usage metrics is available 48-96 hours after online publication and is updated daily on week days.
Initial download of the metrics may take a while.