Fig. 11.
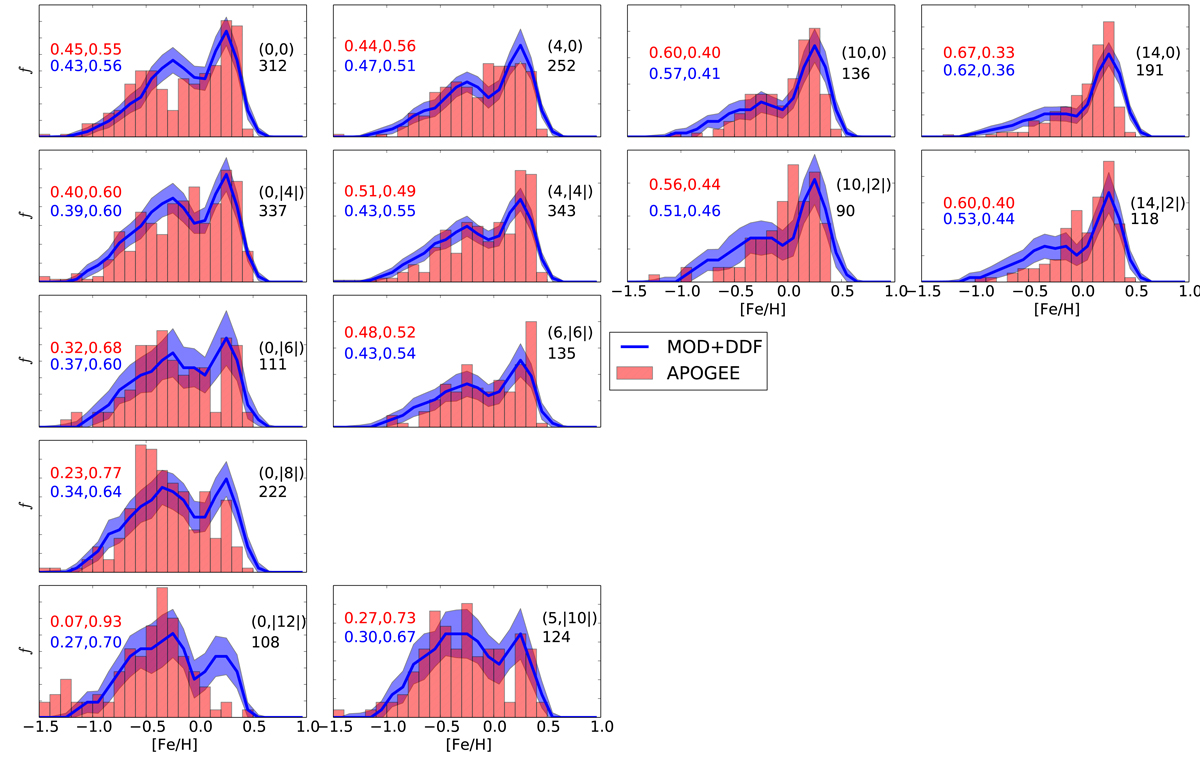
MDF of the MW bulge using APOGEE DR13 data (red) compared to the MDF of the model+DDF (blue). For the model MDF+DDF we show the median (solid blue line) and dispersion (shaded blue area) for 100 realisations (see text for details). The field is indicated in the top right corner of each panel and below it we give the number of stars used in each field to construct the APOGEE MDF. In the top left corner of the panel we show the fractional contribution of the MR ([Fe/H] > 0) and MP ([Fe/H] < 0) populations for each field examined, for the APOGEE data (red) and for the model+DDF (blue).
Current usage metrics show cumulative count of Article Views (full-text article views including HTML views, PDF and ePub downloads, according to the available data) and Abstracts Views on Vision4Press platform.
Data correspond to usage on the plateform after 2015. The current usage metrics is available 48-96 hours after online publication and is updated daily on week days.
Initial download of the metrics may take a while.