Fig. 10.
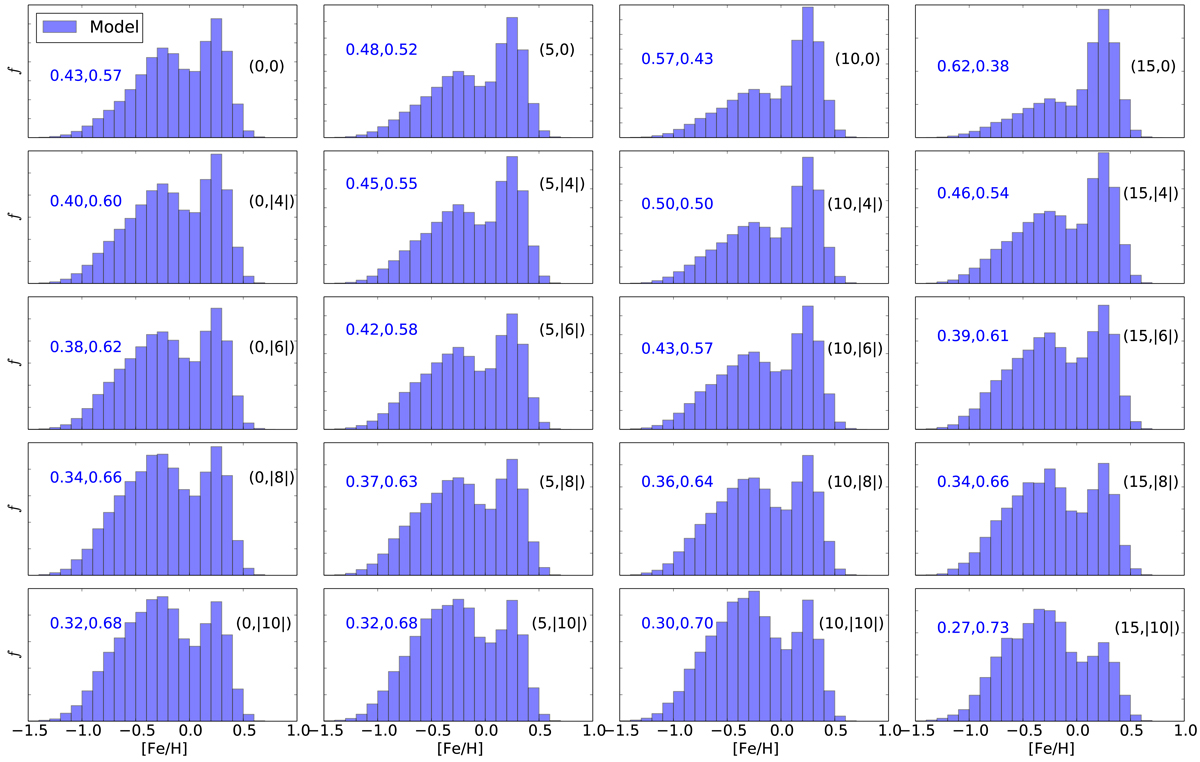
MDF of the model (without the APOGEE distance distribution applied) for the fields outlined with a dashed line in Fig. 9, where the field is indicated in the top-right corner of each panel. In the top-left corner of the panels, we show the fractional contribution of the MR ([Fe/H] > 0) and MP ([Fe/H] < 0) populations for each field examined. The histograms are normalised so that the total area under the curve is equal to 1.
Current usage metrics show cumulative count of Article Views (full-text article views including HTML views, PDF and ePub downloads, according to the available data) and Abstracts Views on Vision4Press platform.
Data correspond to usage on the plateform after 2015. The current usage metrics is available 48-96 hours after online publication and is updated daily on week days.
Initial download of the metrics may take a while.