Fig. 9.
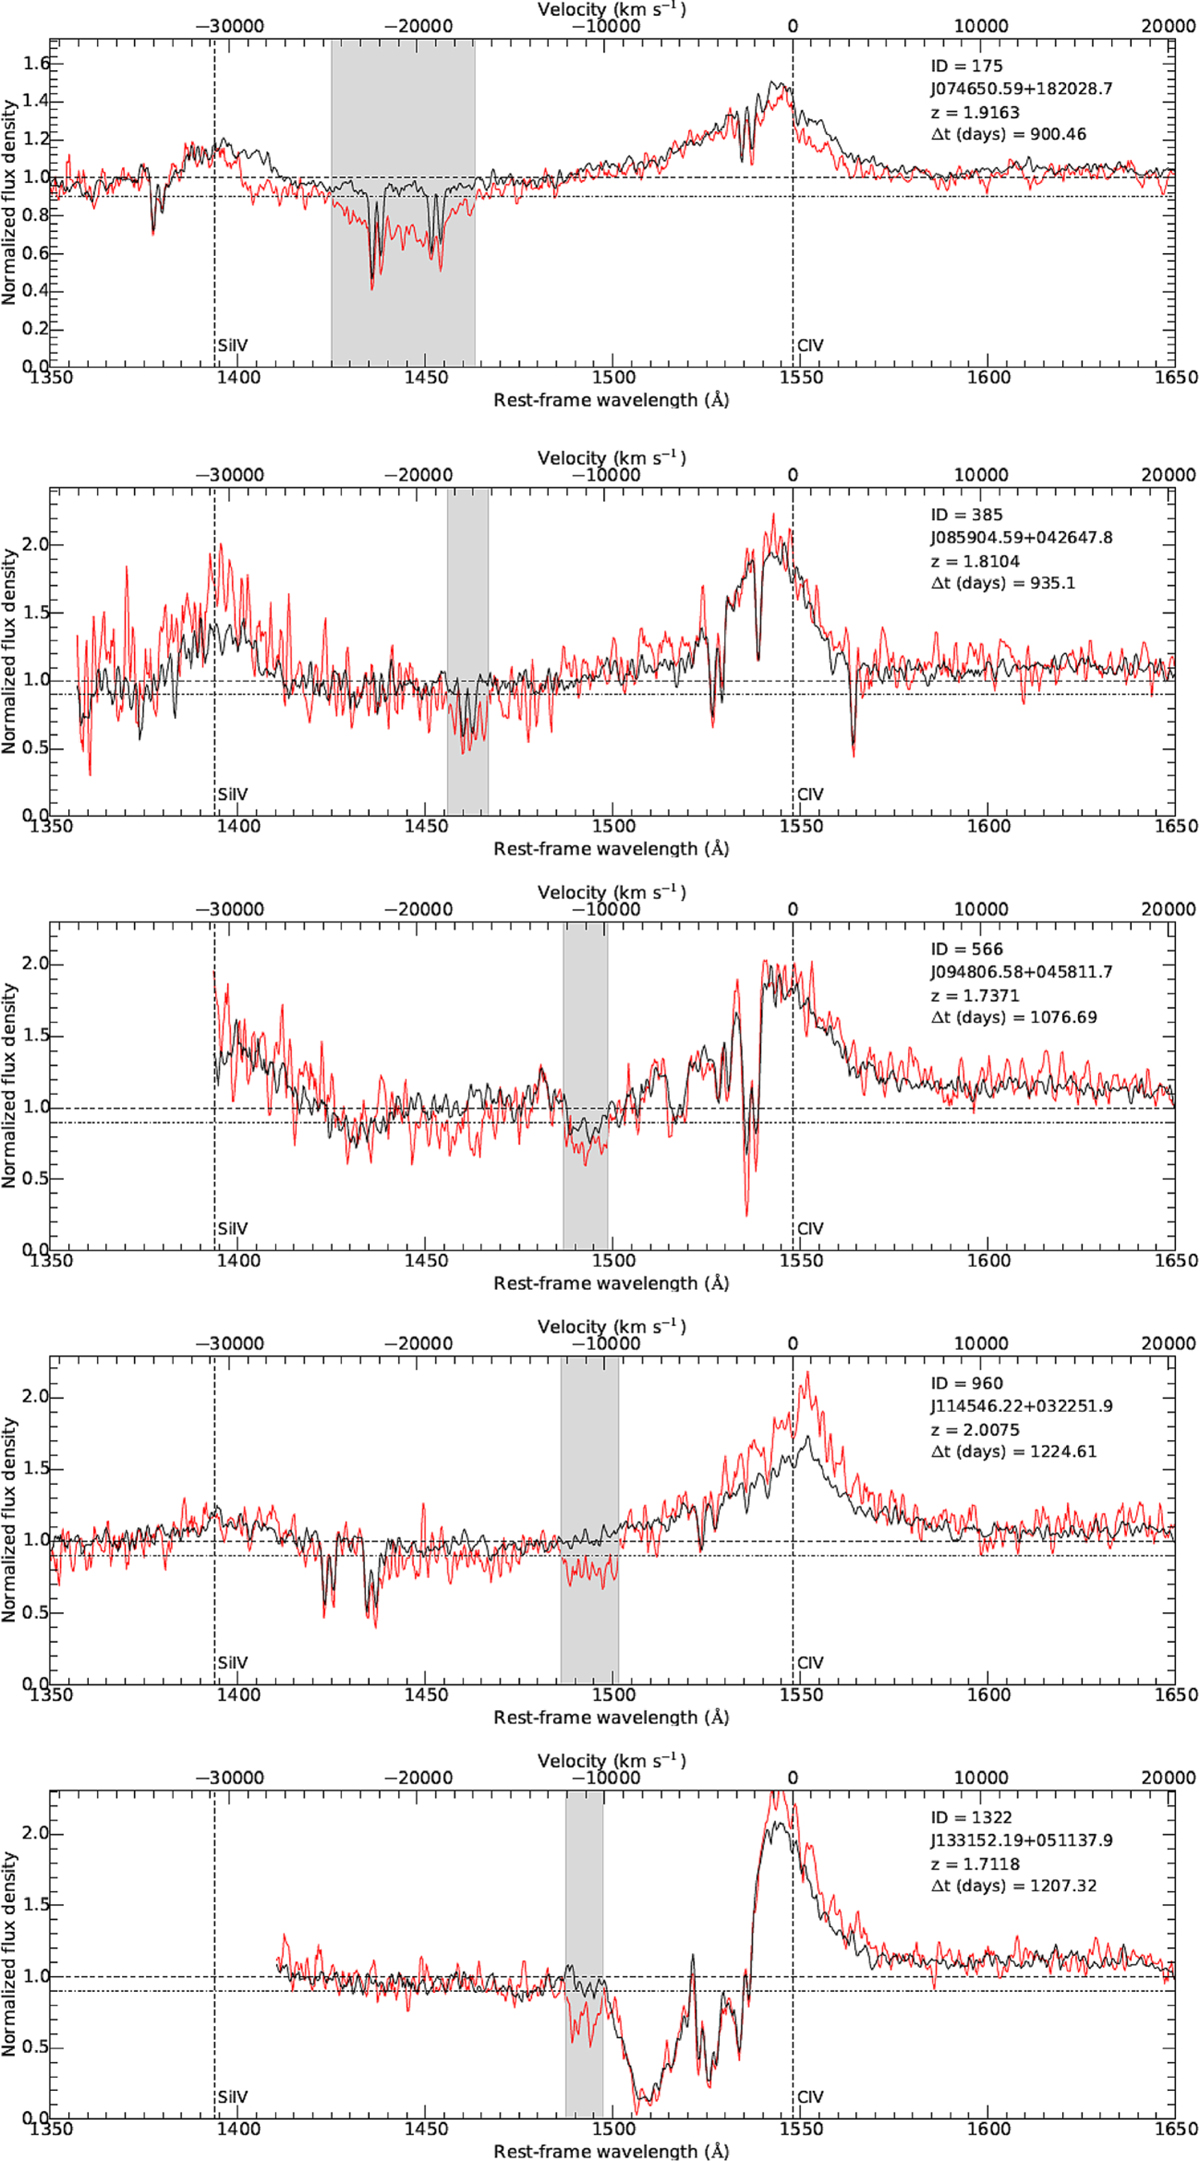
The five SDSS-I/II (red) and BOSS (black) spectra where disappearing BAL troughs were detected by Filiz Ak et al. (2012), but not in the present work. The top right of each panel contains the ID of the corresponding source from our catalog, the SDSS ID, the redshift, and the rest-frame time difference between the two spectra represented. Plots are limited to the wavelength range 1350–1650 Å for a better visualization of the window where C IV BAL disappearance can be observed. Rest-frame wavelength (bottom) and velocity (top) are reported on the horizontal axes, while the normalized flux density is shown on the vertical axis. The horizontal dashed line represents the level where normalized flux density equals unity, while the dash-dot line indicates the 0.9 level for the normalized flux density; our analysis concerns BAL troughs extending below this threshold. The two vertical dashed lines represent the rest-frame wavelengths corresponding to the Si IV and C IV emission lines (1394 Å and 1549 Å, respectively). In the case of QSO J114546.22+032251.9, there are two peaks – and not just one – in the SDSS-I/II spectrum crossing the threshold upwards, so three adjacent troughs comprise the BAL; nevertheless, the first two corresponding to higher velocities are sufficient to make a BAL trough if their widths are summed.
Current usage metrics show cumulative count of Article Views (full-text article views including HTML views, PDF and ePub downloads, according to the available data) and Abstracts Views on Vision4Press platform.
Data correspond to usage on the plateform after 2015. The current usage metrics is available 48-96 hours after online publication and is updated daily on week days.
Initial download of the metrics may take a while.