Fig. 8.
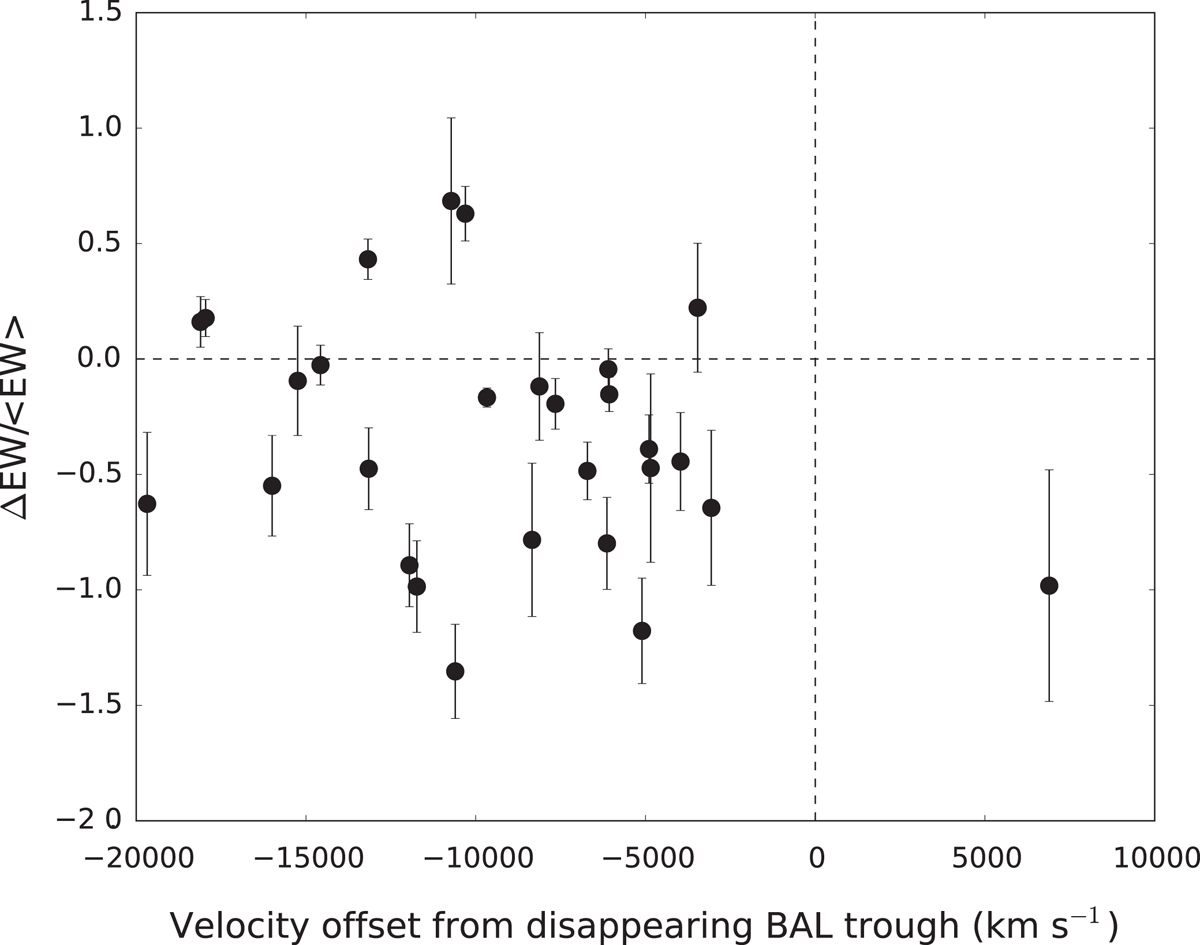
Fractional EW variations for the 28 non-disappearing BAL troughs in the ND sample. The two epochs used for each trough are the same as in Fig. 7. The horizontal axis shows the offset of the central velocity υcND of each non-disappearing trough with respect to the υc of the corresponding disappearing trough. The central velocity for a trough is defined as υc = (υmax + υmin)/2; error bars are computed propagating the errors on the EWs in the two epochs. The horizontal and the vertical dashed lines represent the zero levels for each axis, and are plotted for a better identification of the various regions in the diagram.
Current usage metrics show cumulative count of Article Views (full-text article views including HTML views, PDF and ePub downloads, according to the available data) and Abstracts Views on Vision4Press platform.
Data correspond to usage on the plateform after 2015. The current usage metrics is available 48-96 hours after online publication and is updated daily on week days.
Initial download of the metrics may take a while.