Fig. 7.
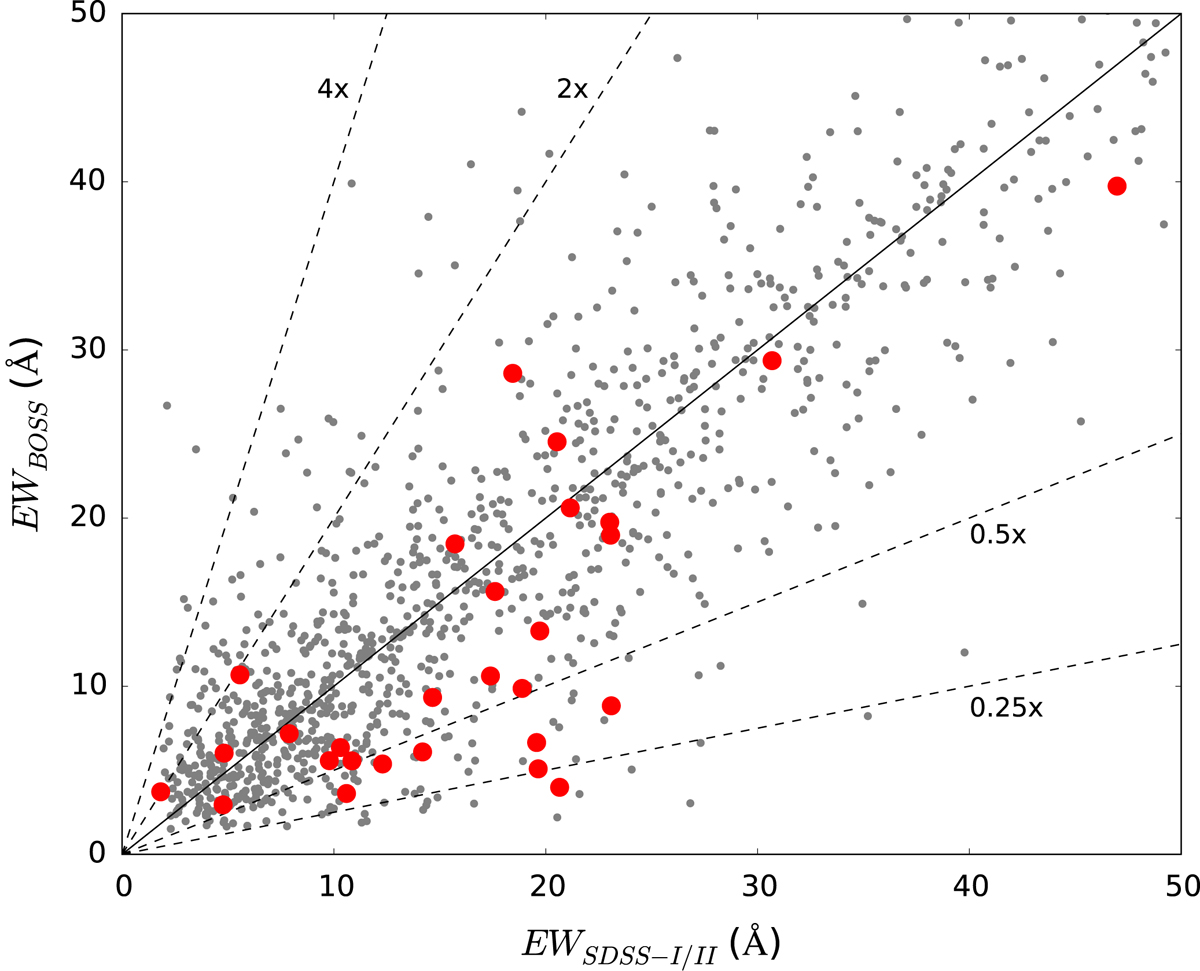
EWs at two different epochs for the QSOs belonging to the ND sample (large red dots). For each BAL trough, the two EW measurements are obtained from the same epoch pair where disappearance is detected. Small grey dots in the background show the EWs at two epochs (one from SDSS-I/II and one from BOSS) for all the sources in the main sample having non-disappearing BAL troughs. We limit our investigation to BAL troughs in SDSS-I/II spectra that correspond to BAL troughs in BOSS spectra, hence BALs turning into mini-BALs, or vice versa, are not taken into account. The solid line indicates where the EWs of the two compared epochs are equal, while the four dashed lines indicate where the EW of the BOSS epoch is four times, two times, half of, and a quarter of the EW in the SDSS-I/II epoch.
Current usage metrics show cumulative count of Article Views (full-text article views including HTML views, PDF and ePub downloads, according to the available data) and Abstracts Views on Vision4Press platform.
Data correspond to usage on the plateform after 2015. The current usage metrics is available 48-96 hours after online publication and is updated daily on week days.
Initial download of the metrics may take a while.