Fig. 5.
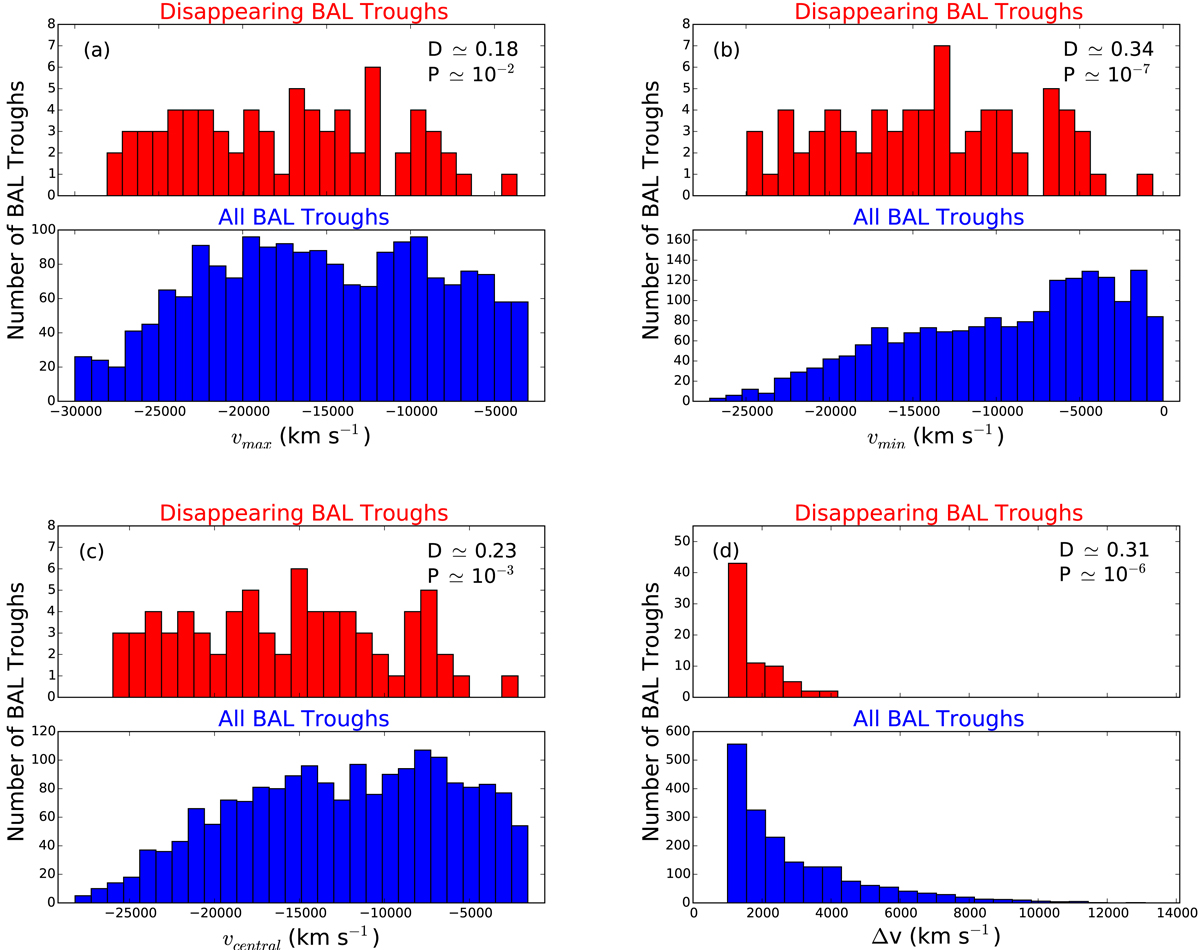
Maximum observed velocity υmax (panel a), minimum observed velocity υmin (panel b), central velocity υc (panel c), and BAL width Δυ (panel d) distributions for the P4 sample (upper histogram in each panel) and for the main sample of sources with BAL troughs (lower histogram in each panel). Results of the K-S test performed on each pair of cumulative distributions are reported in each panel: D is the maximum distance between the two cumulative distributions, and P is the probability of obtaining a higher D value assuming that the two datasets are drawn from the same distribution function.
Current usage metrics show cumulative count of Article Views (full-text article views including HTML views, PDF and ePub downloads, according to the available data) and Abstracts Views on Vision4Press platform.
Data correspond to usage on the plateform after 2015. The current usage metrics is available 48-96 hours after online publication and is updated daily on week days.
Initial download of the metrics may take a while.