Fig. 2.
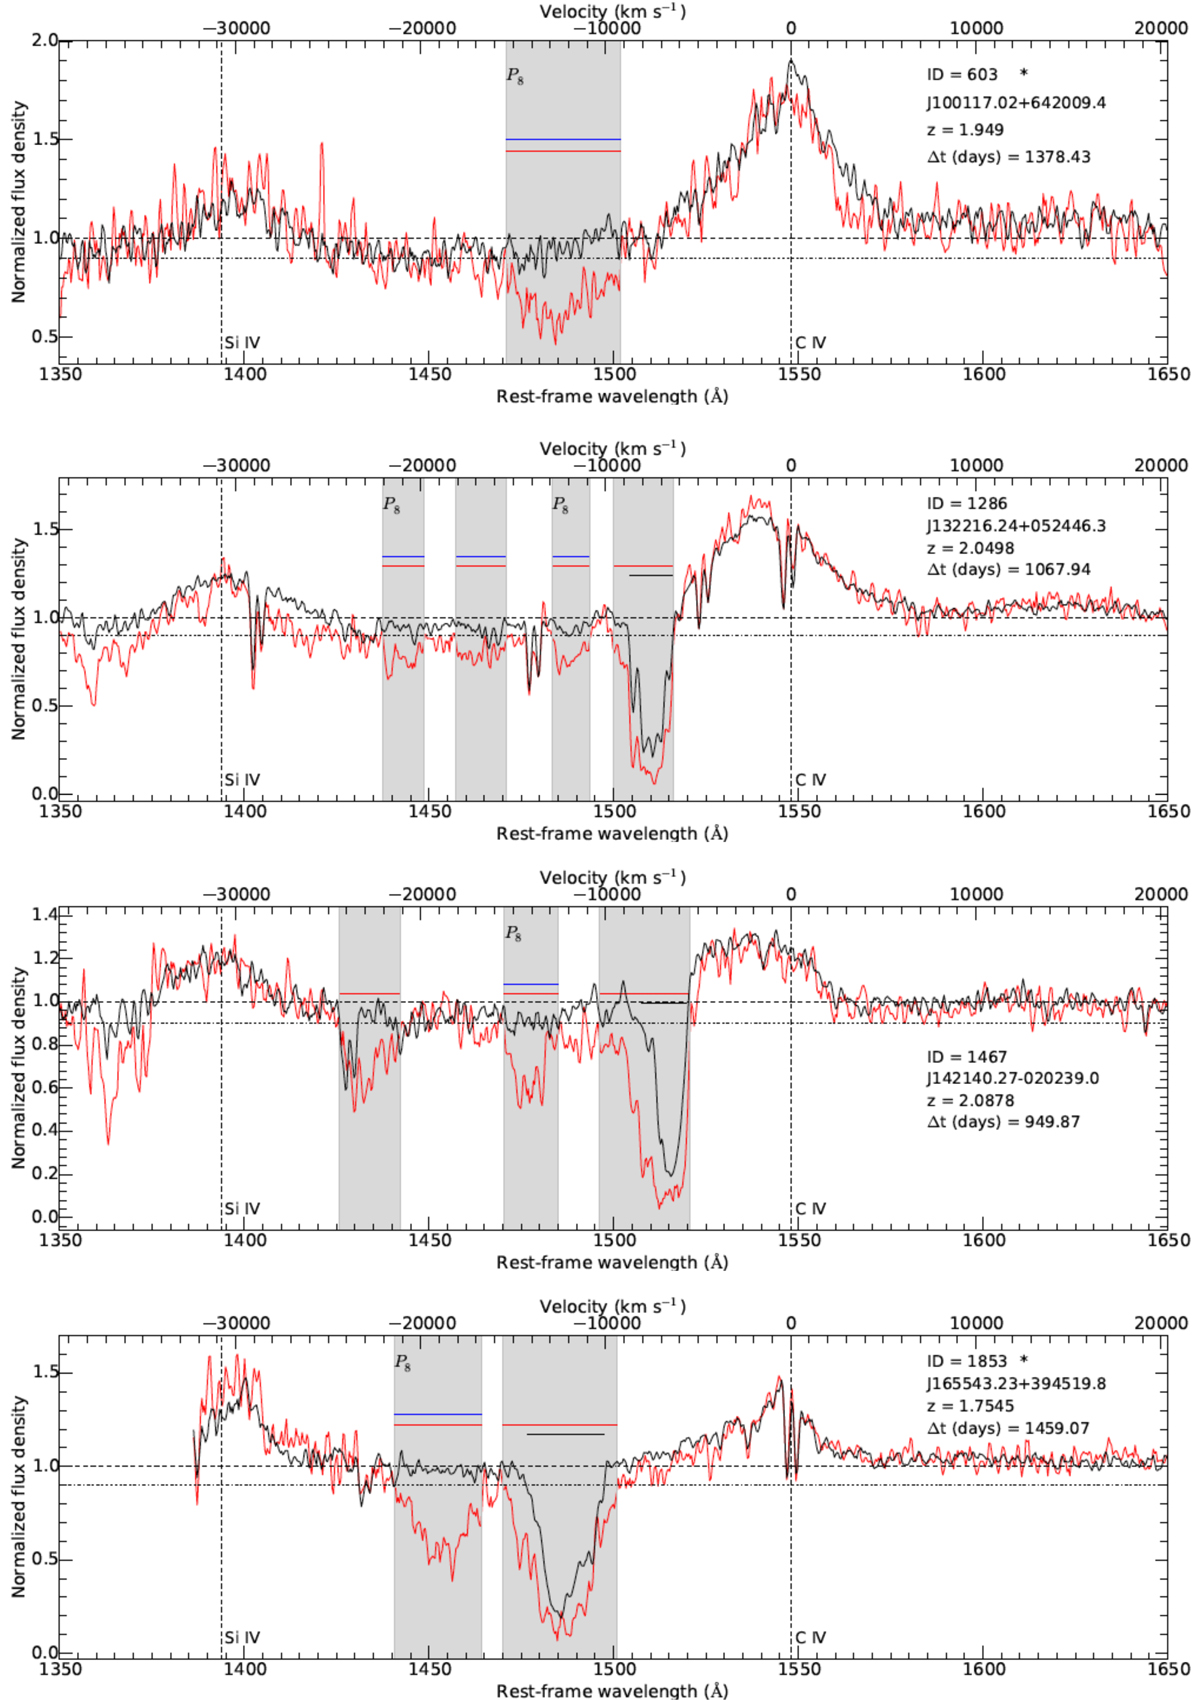
SDSS-I/II (red) and BOSS (black) spectra showing disappearing BAL troughs. The top right of each panel reports the ID in our catalog, the SDSS ID, the redshift, and the rest-frame time difference between the two plotted spectra; the presence of a star next to the source ID identifies the BAL troughs belonging to the pristine sample. Plots are limited to the wavelength range 1350–1650 Åfor a better visualization of the window where C IV BAL disappearance can be observed. Rest-frame wavelength (bottom) and velocity (top) are reported on the horizontal axes, while the normalized flux density is shown on the vertical axis. The horizontal dashed line represents the level where normalized flux density equals unity, while the dash-dot line indicates the 0.9 level for the normalized flux density; our analysis concerns BAL troughs extending below this threshold. The two vertical dashed lines represent the rest-frame wavelengths corresponding to the Si IV and C IV emission lines (1394 Å and 1549 Å, respectively). Red and black horizontal lines identify BAL troughs in the SDSS-I/II spectra and BOSS spectra, respectively, while blue bars mark SDSS-I/II BAL troughs that disappear in BOSS spectra. The lack of either black lines or blue bars in a BOSS spectrum in correspondence of a BAL trough in the SDSS-I/II spectrum means that the BAL trough has turned into one or more mini-BALs, or that the disappearance is not considered reliable (Pχ2 > 10−4). The regions corresponding to SDSS-I/II BAL troughs are shaded for better visualization. A “P8” above a shaded area marks disappearing BAL troughs belonging to the P8 sample. In some cases, BAL troughs outside the velocity range −30 000–0 km s−1 are apparent, but they are not taken into account in the present analysis (see Sect. 2.2). An extended version of this figure, including all the sources in our P4 sample, is available in Fig. A.1.
Current usage metrics show cumulative count of Article Views (full-text article views including HTML views, PDF and ePub downloads, according to the available data) and Abstracts Views on Vision4Press platform.
Data correspond to usage on the plateform after 2015. The current usage metrics is available 48-96 hours after online publication and is updated daily on week days.
Initial download of the metrics may take a while.