Fig. 1.
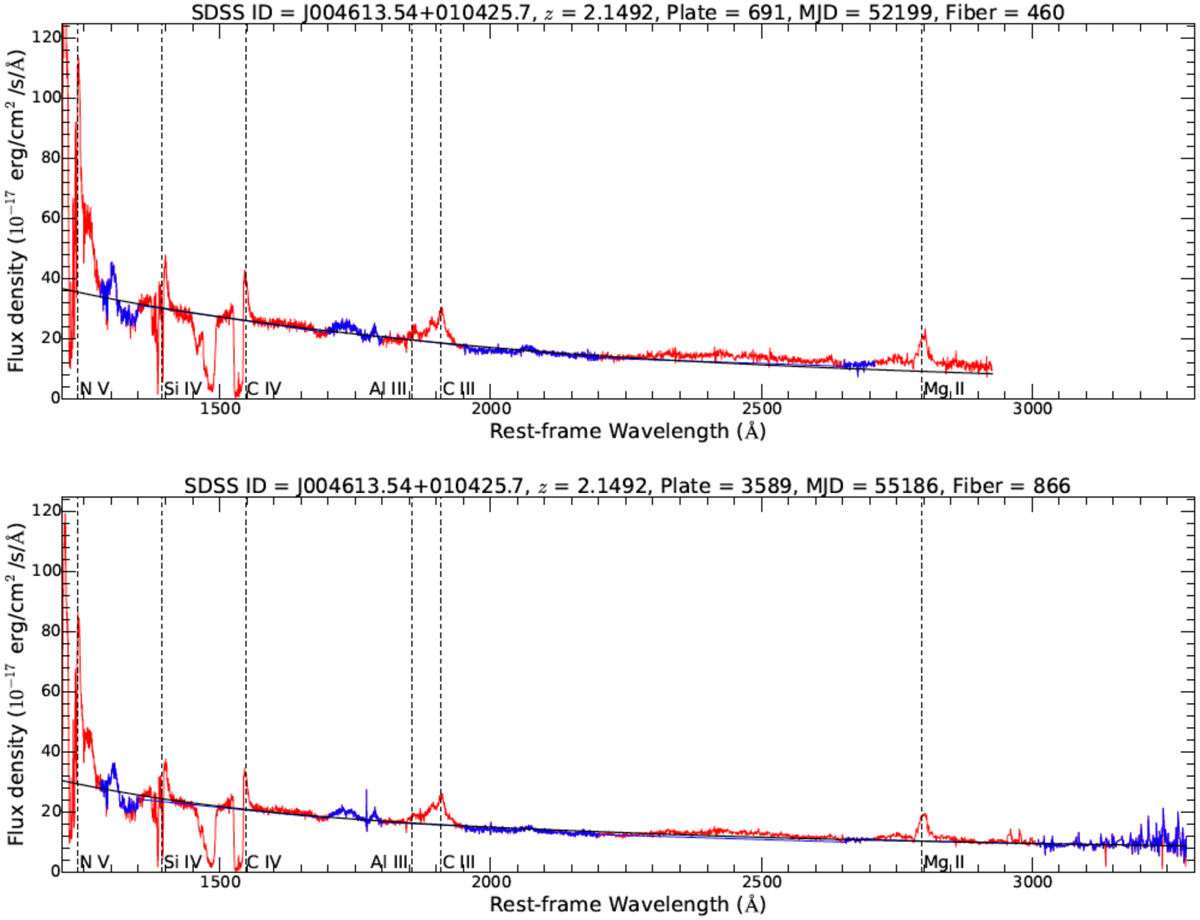
Examples of continuum-model fits for a pair of spectra (SDSS-I/II in the upper panel, BOSS in the lower panel) where we observe C IV BAL disappearance. The red line represents the signal as a function of the rest-frame wavelength, while the blue regions indicate the RLF windows used to fit the continuum model, which is shown by the solid black line. Vertical dashed lines indicate rest-frame wavelengths corresponding to features that are typically seen in QSOs. The source ID in the SDSS archive, together with its redshift and information about the plate, MJD, and fiber corresponding to the observation, are also reported on top of each panel.
Current usage metrics show cumulative count of Article Views (full-text article views including HTML views, PDF and ePub downloads, according to the available data) and Abstracts Views on Vision4Press platform.
Data correspond to usage on the plateform after 2015. The current usage metrics is available 48-96 hours after online publication and is updated daily on week days.
Initial download of the metrics may take a while.