Fig. 7.
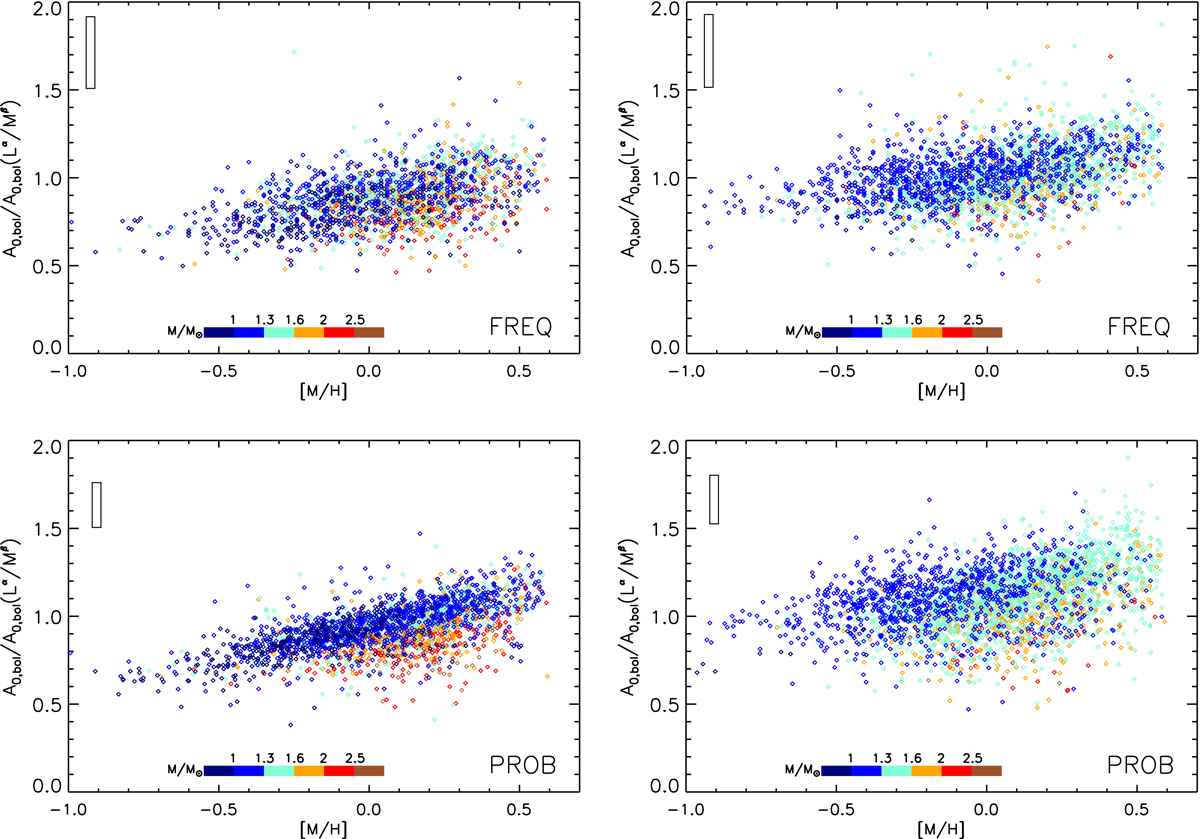
Bolometric amplitudes (A0,bol) corrected for the L and M dependencies as a function of the stellar metallicity for the FREQ method (top) and the PROB method (bottom), with the stellar mass color-coded. Clump stars are shown in the left panels and RGB stars in the right panels. The black rectangle corresponds to the typical uncertainties.
Current usage metrics show cumulative count of Article Views (full-text article views including HTML views, PDF and ePub downloads, according to the available data) and Abstracts Views on Vision4Press platform.
Data correspond to usage on the plateform after 2015. The current usage metrics is available 48-96 hours after online publication and is updated daily on week days.
Initial download of the metrics may take a while.