Free Access
Fig. 6.
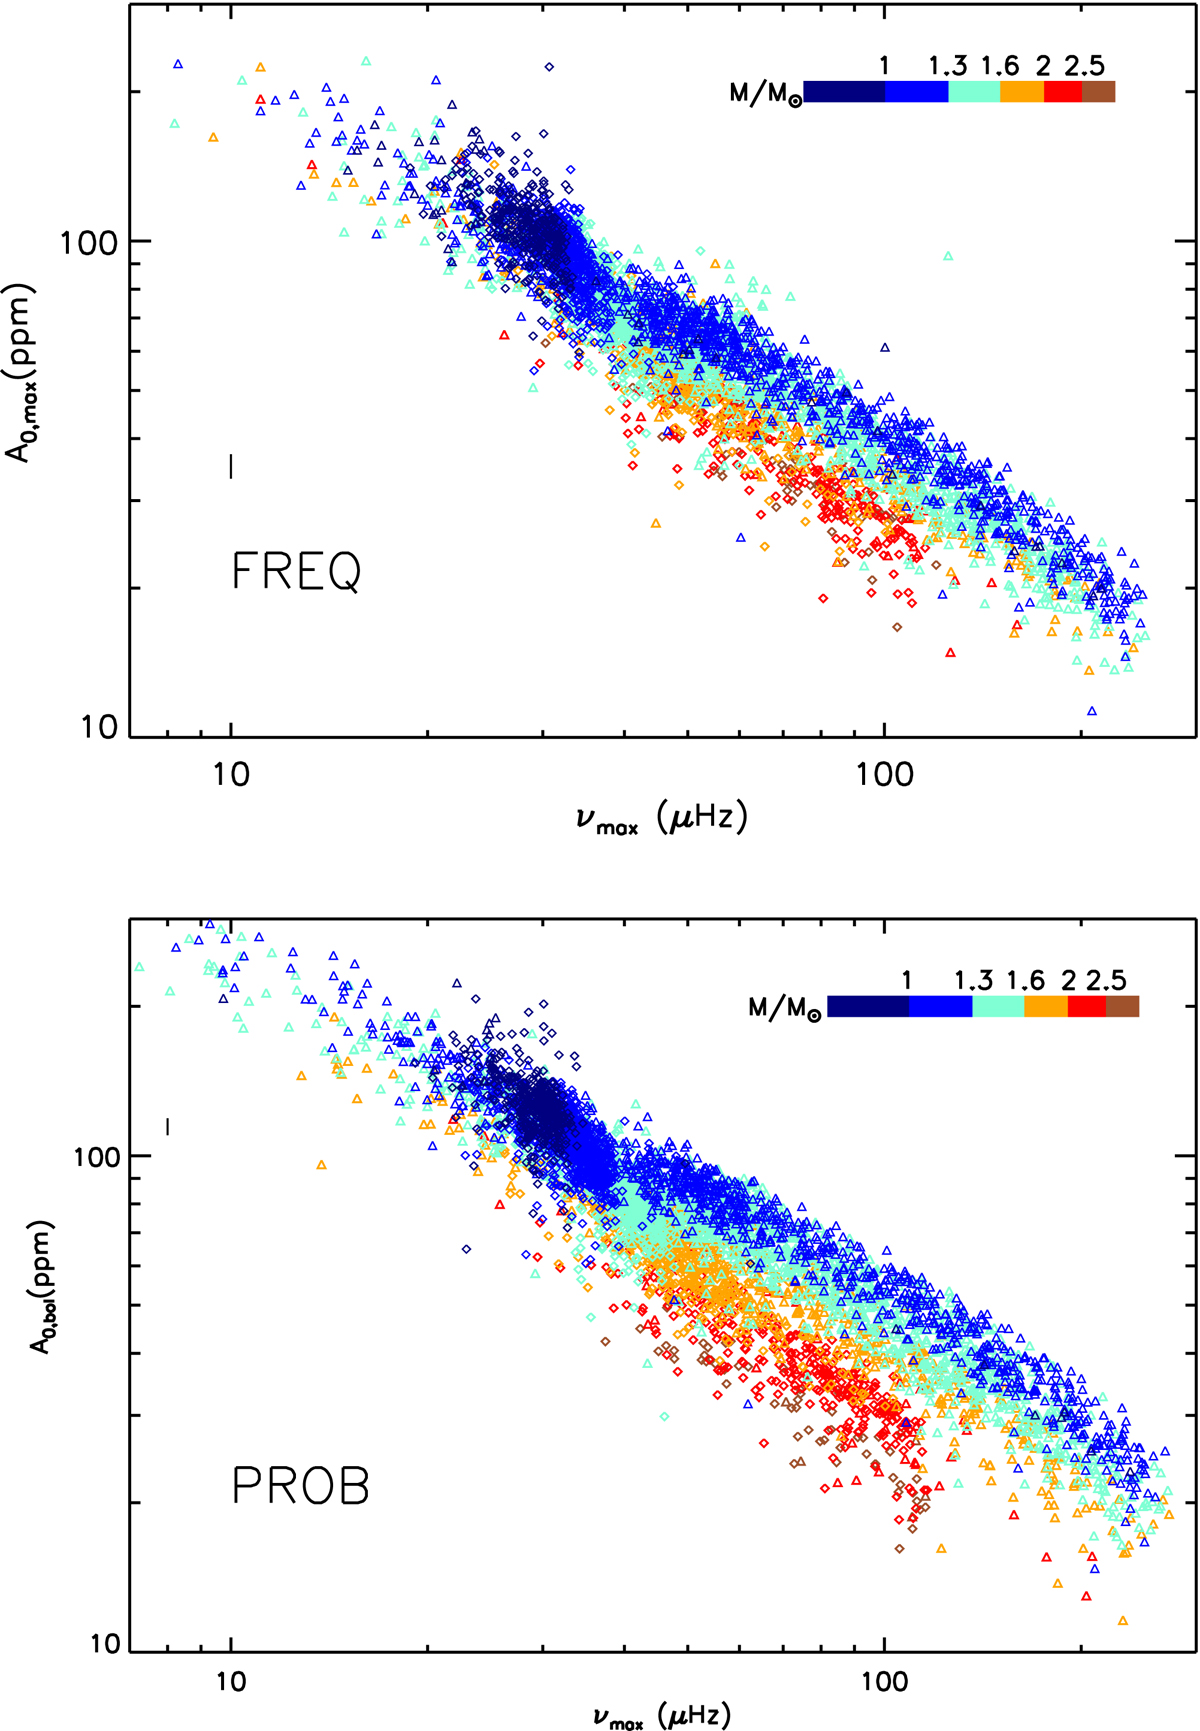
Bolometric amplitudes A0,bol as a function of νmax for the FREQ method (top) and for the PROB method (bottom). The color code indicates stellar mass. The diamond and triangle symbols indicate clump and RGB stars, respectively. The black line corresponds to the mean uncertainties.
Current usage metrics show cumulative count of Article Views (full-text article views including HTML views, PDF and ePub downloads, according to the available data) and Abstracts Views on Vision4Press platform.
Data correspond to usage on the plateform after 2015. The current usage metrics is available 48-96 hours after online publication and is updated daily on week days.
Initial download of the metrics may take a while.