Fig. 4.
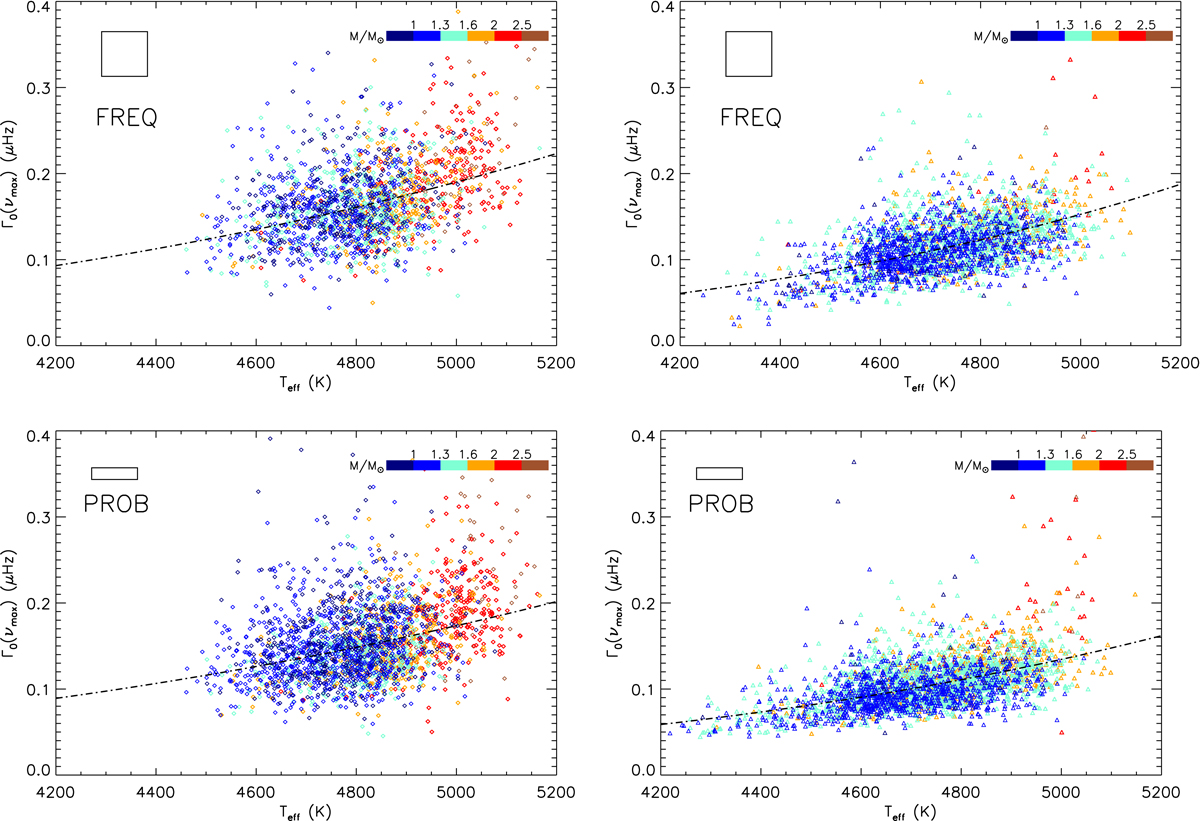
Global radial mode widths Γ0(νmax) as a function of the effective temperatures Teff for the FREQ method (top) and for the PROB method (bottom). Clump and RGB stars are shown in the left and right panels, respectively, with their mass color-coded. The black squares indicate the typical uncertainties and the black dashed-dotted lines give the width-temperature relation fitted for each set of stars.
Current usage metrics show cumulative count of Article Views (full-text article views including HTML views, PDF and ePub downloads, according to the available data) and Abstracts Views on Vision4Press platform.
Data correspond to usage on the plateform after 2015. The current usage metrics is available 48-96 hours after online publication and is updated daily on week days.
Initial download of the metrics may take a while.