Fig. 2.
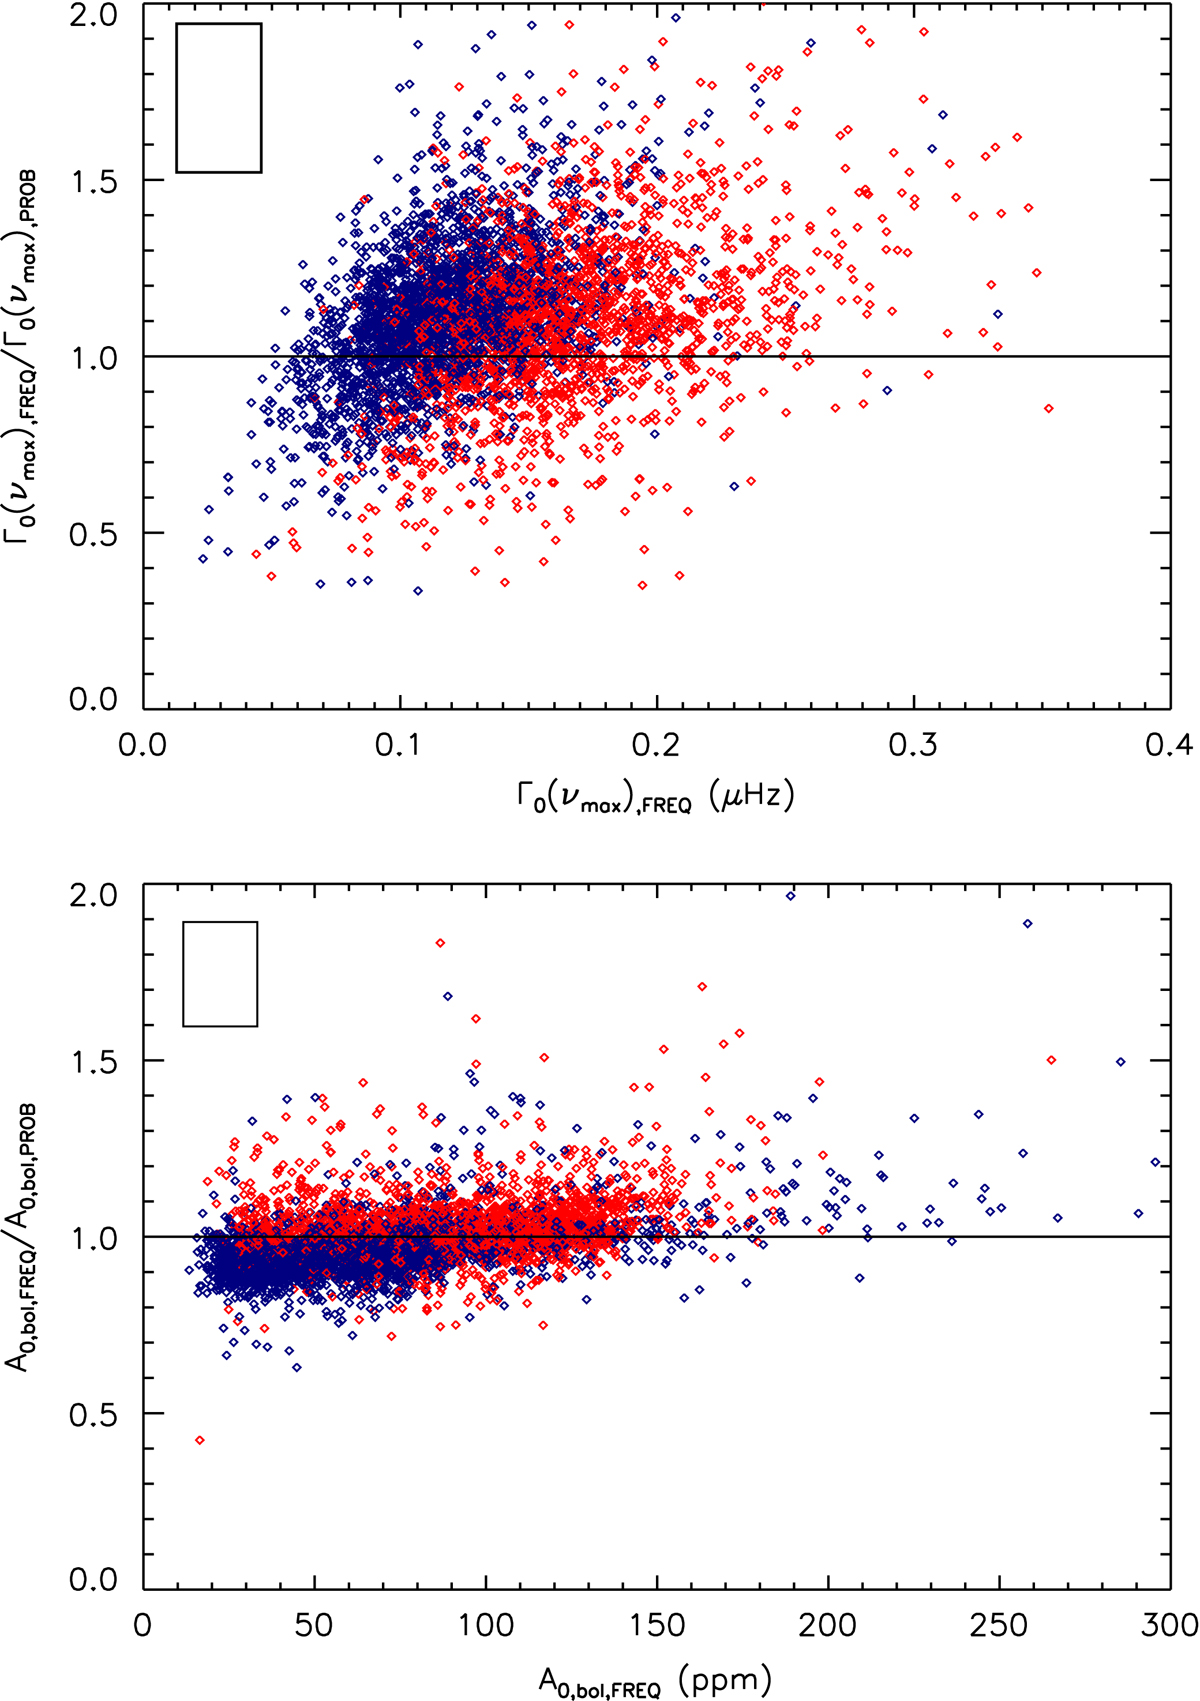
Top: ratio between the global radial mode widths Γ0(νmax) obtained with the FREQ method and those obtained with the PROB method as a function of the global radial mode width Γ0(νmax) obtained with the FREQ method. Bottom: ratio between the bolometric amplitudes A0,bol obtained with the FREQ method and those obtained with the PROB method as a function of the bolometric amplitudes A0,bol obtained with the FREQ method. For both panels, the black line represents the 1:1 relation and the mean uncertainties are given by the black rectangle in the upper left corner. The red diamond and blue triangle symbols indicate clump and RGB stars, respectively.
Current usage metrics show cumulative count of Article Views (full-text article views including HTML views, PDF and ePub downloads, according to the available data) and Abstracts Views on Vision4Press platform.
Data correspond to usage on the plateform after 2015. The current usage metrics is available 48-96 hours after online publication and is updated daily on week days.
Initial download of the metrics may take a while.