Fig. 3
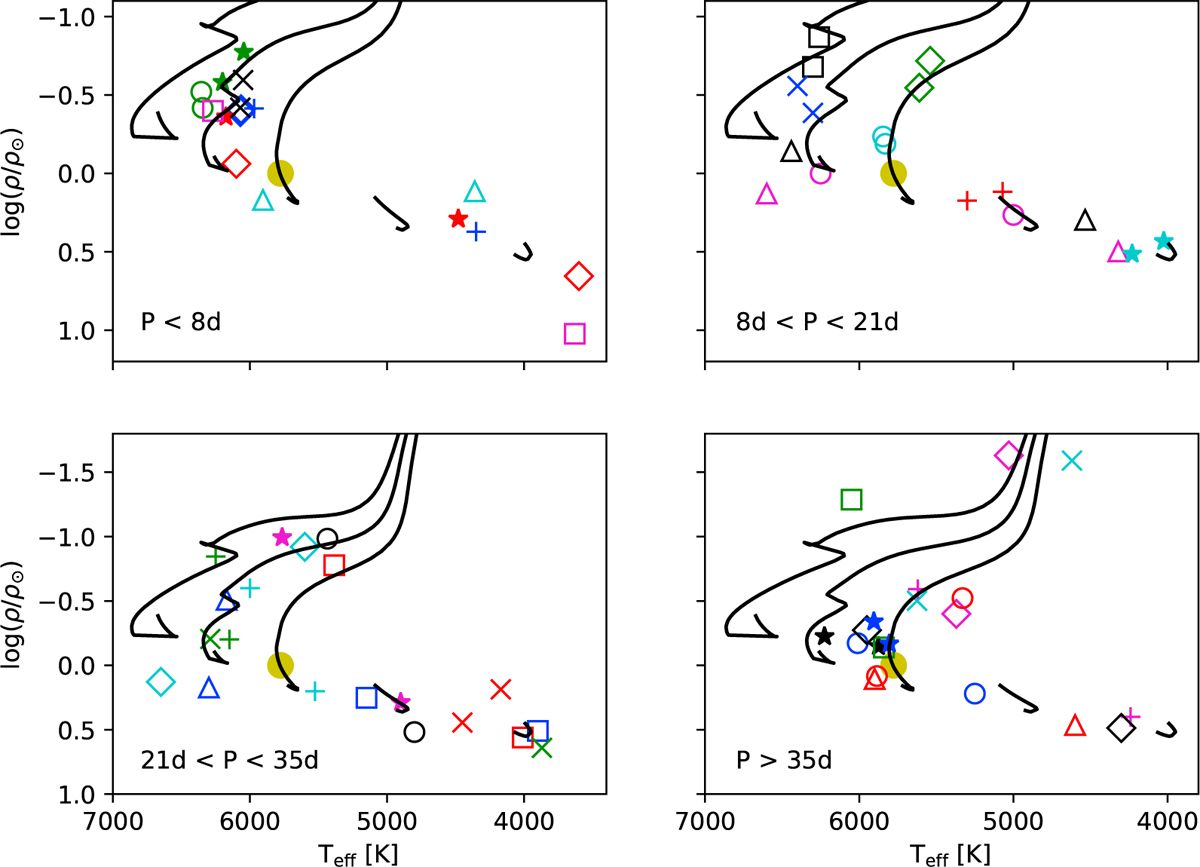
Targets in the effective temperature – mean stellar density plane compared to stellar evolution tracks from the Dartmouth stellar evolution database for solar composition (Dotter et al. 2008). The evolution tracks are truncated at an age of 13 Gyr. The location of the Sun in this plane is shown with a filled yellow circle. Stars from the same binary system are plotted using the same symbol. Evolution tracks are shown for stellar masses from 0.6 M⊙ to 1.4 M⊙ in steps of 0.2 M⊙. Stars are plotted in one of four panels according to the orbital period of the binary, as noted in each panel.
Current usage metrics show cumulative count of Article Views (full-text article views including HTML views, PDF and ePub downloads, according to the available data) and Abstracts Views on Vision4Press platform.
Data correspond to usage on the plateform after 2015. The current usage metrics is available 48-96 hours after online publication and is updated daily on week days.
Initial download of the metrics may take a while.