Fig. 5
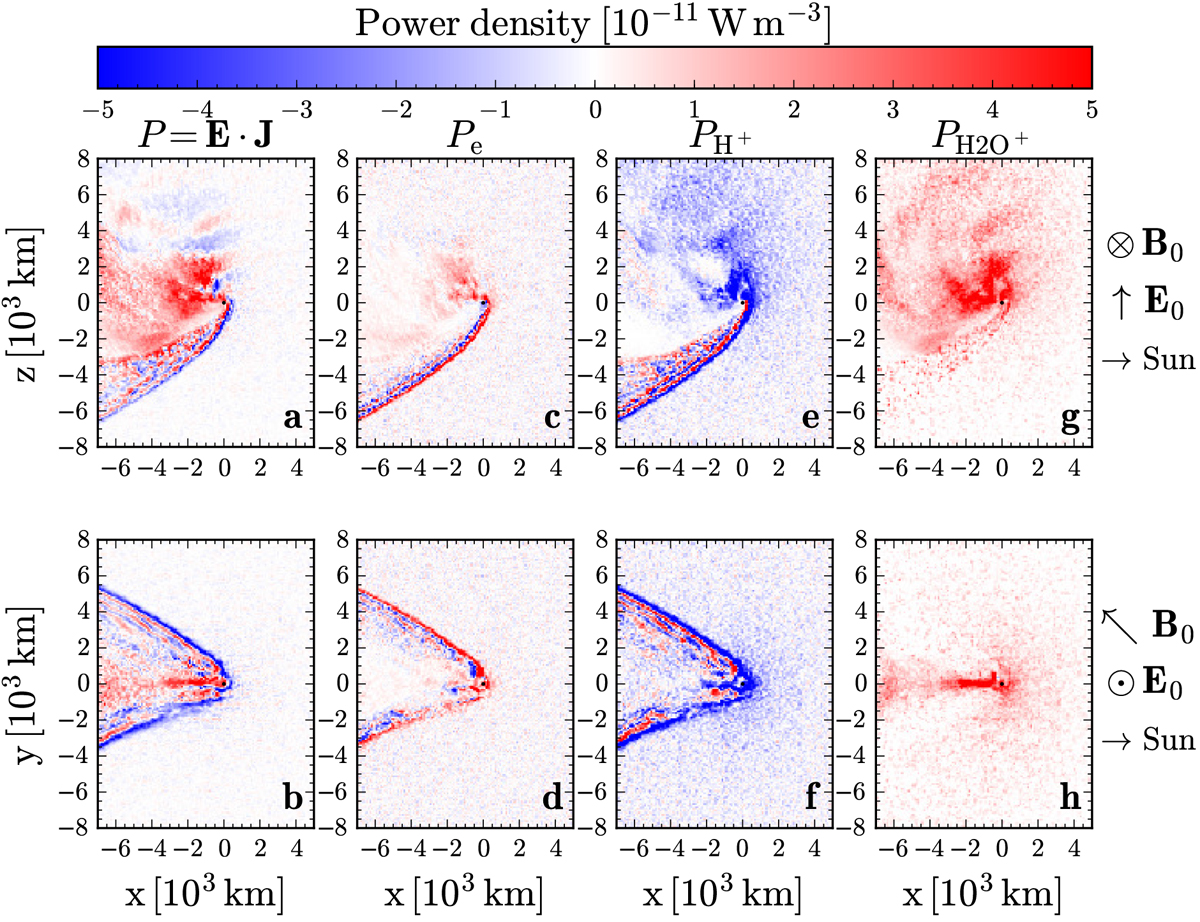
Total power density (panels a, b), which is the sum of the electron power density (panels c, d), the solar wind proton power density (panels e, f), and the cometary water ion power density (panels g, h). We show cuts for the y = 0 and z = 0 planes around the comet at 1.5 AU during weakly ionizing solar conditions. Red (E ⋅ J > 0) is where the electromagnetic field exerts work on charged particles, while blue (E ⋅ J < 0) shows the opposite. The comet nucleus is marked by black crosshairs. The local geometry for each row of panels is shown to the right of the figure.
Current usage metrics show cumulative count of Article Views (full-text article views including HTML views, PDF and ePub downloads, according to the available data) and Abstracts Views on Vision4Press platform.
Data correspond to usage on the plateform after 2015. The current usage metrics is available 48-96 hours after online publication and is updated daily on week days.
Initial download of the metrics may take a while.