Fig. 3
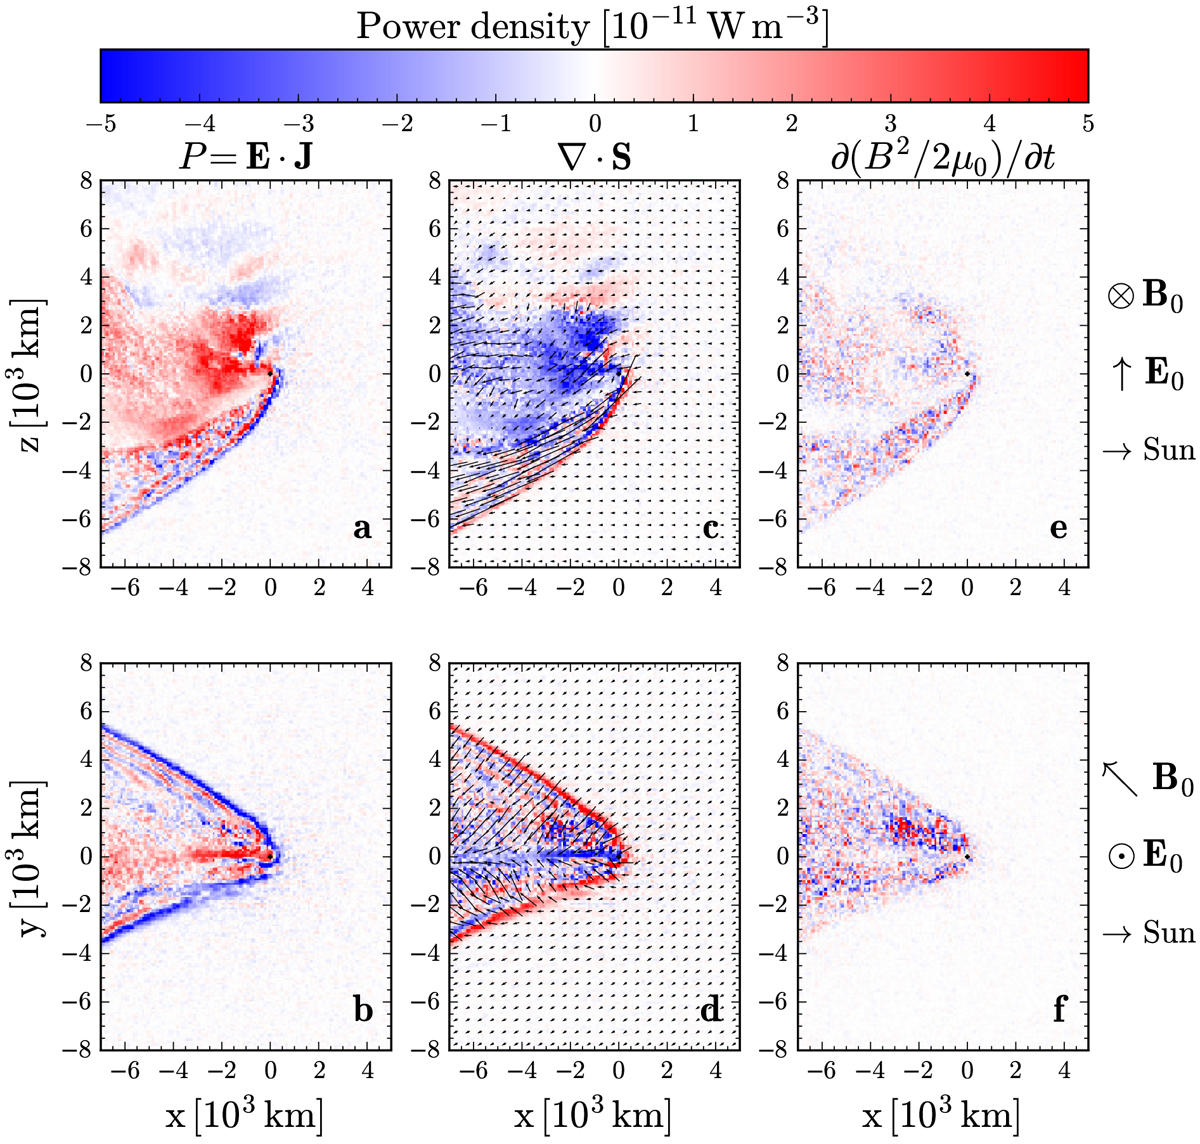
Shown in color is the total power density (panels a, b), the divergence of the Poynting flux (panels c, d), and the time derivative of the electromagnetic energy density (panels e, f), for the y = 0 and z = 0 planes around the comet at 1.5 AU during weakly ionizing solar conditions. The Poynting theorem states that the sum of these three quantities should be zero for all points. The arrows in (panels c, d) mark the direction of the Poynting flux, S = E ×B∕μ0, and their sizes are proportional to the magnitude. The comet nucleus is marked by black crosshairs. The local geometry for each rowof panels is shown to the right of the figure.
Current usage metrics show cumulative count of Article Views (full-text article views including HTML views, PDF and ePub downloads, according to the available data) and Abstracts Views on Vision4Press platform.
Data correspond to usage on the plateform after 2015. The current usage metrics is available 48-96 hours after online publication and is updated daily on week days.
Initial download of the metrics may take a while.