Free Access
Fig. 7
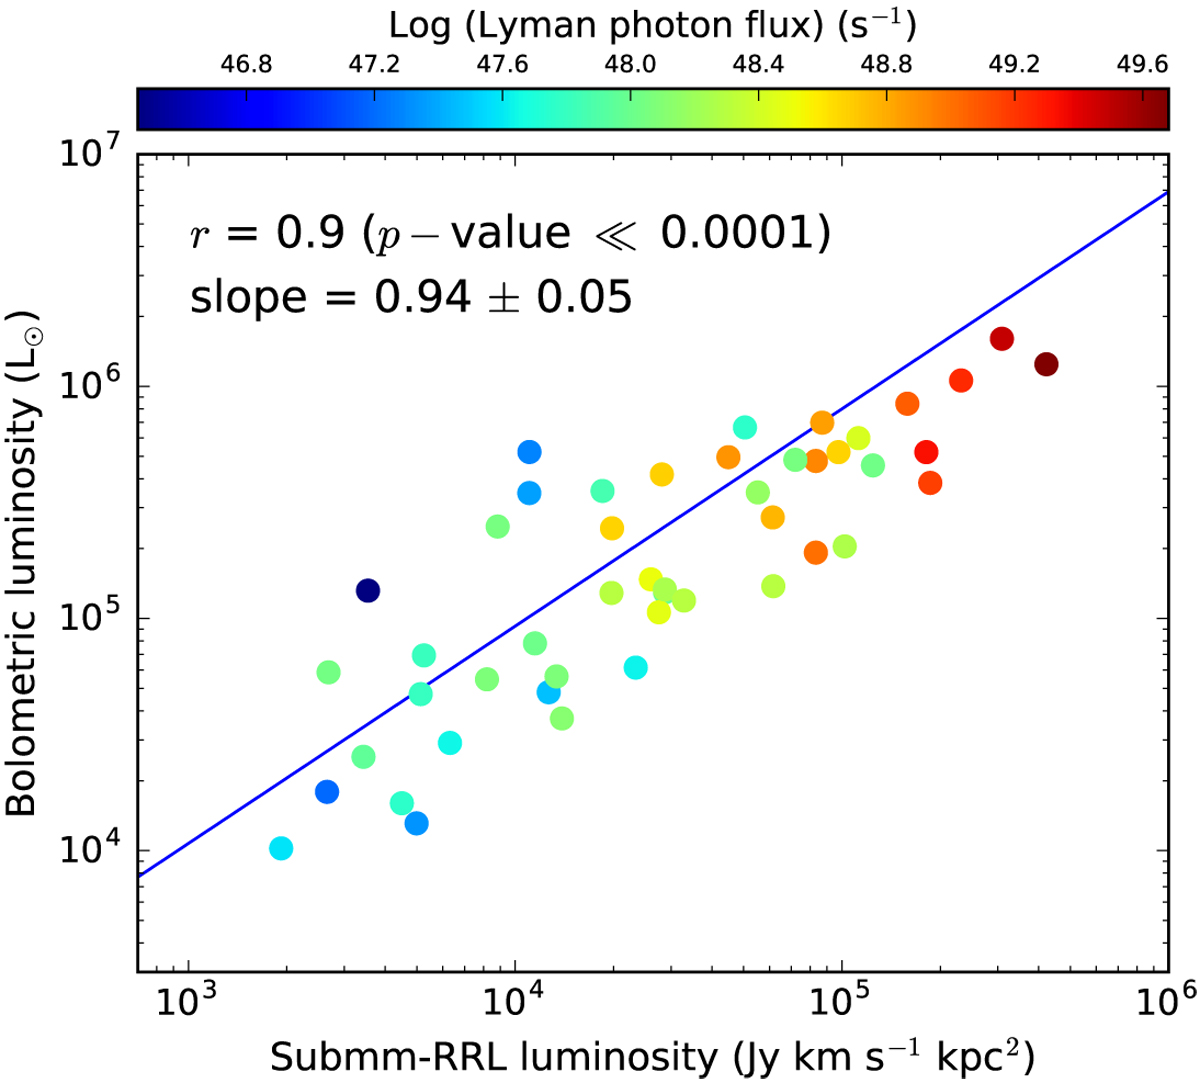
Luminosity of the submm-RRLs versus Lbol of embedded central objects. The color bar indicates the Lyman photon flux of ionizing stars associated with the dust clumps and the submm-RRLs. The best linear fit is presented with the blue line.
Current usage metrics show cumulative count of Article Views (full-text article views including HTML views, PDF and ePub downloads, according to the available data) and Abstracts Views on Vision4Press platform.
Data correspond to usage on the plateform after 2015. The current usage metrics is available 48-96 hours after online publication and is updated daily on week days.
Initial download of the metrics may take a while.