Fig. 4
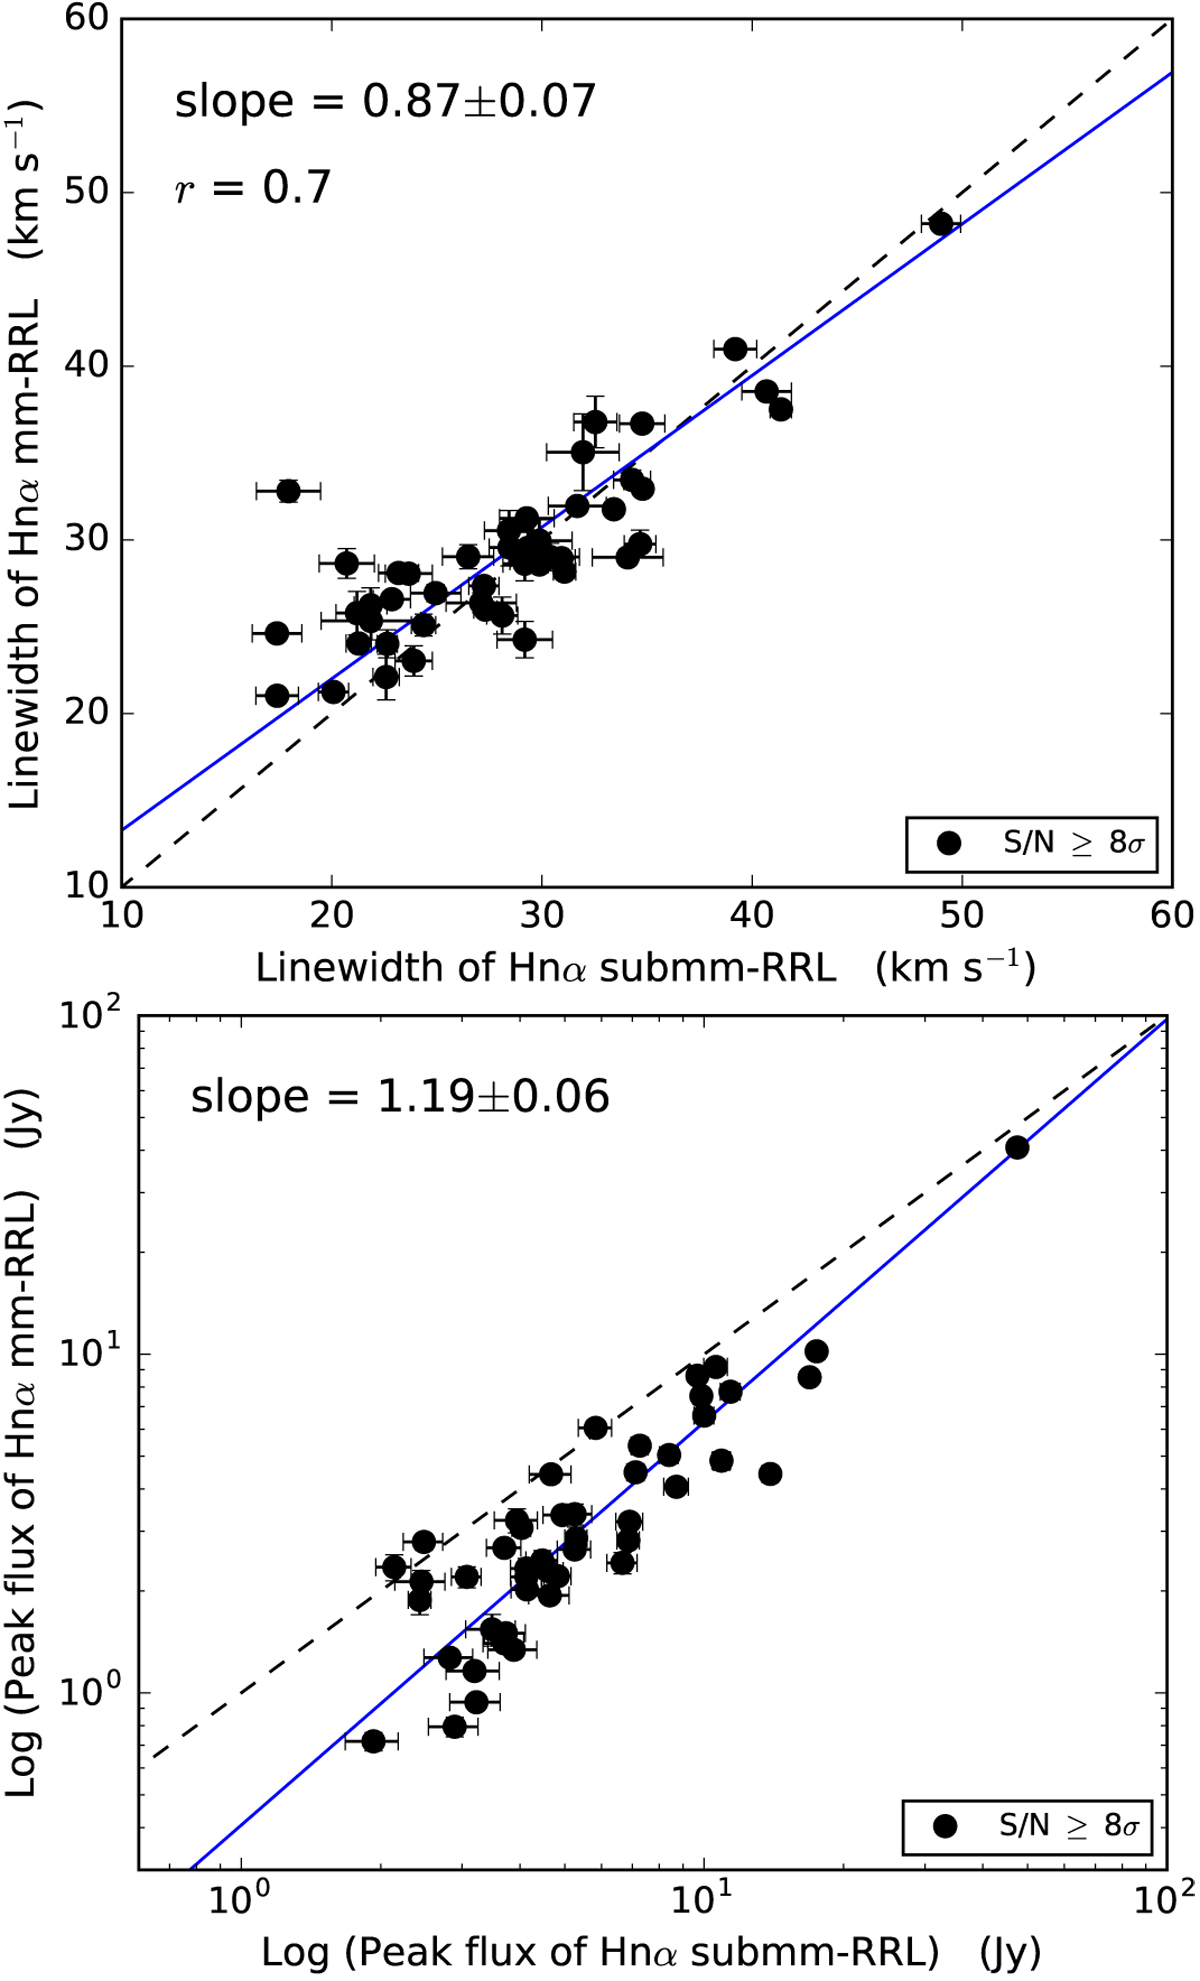
Upper panel: linewidth comparison of stacked mm- and submm-RRLs. The black filled circles indicate sources with a peak flux with S/N ≥ 8 σ of both RRLs. Lower panel: peak flux comparison of stacked mm- and submm-RRL. The black symbols are the same as in the upper panel. The black dashed lines indicate the locus of equal linewidths and fluxes. The blue lines show the best fit from BCES bisector fitting.
Current usage metrics show cumulative count of Article Views (full-text article views including HTML views, PDF and ePub downloads, according to the available data) and Abstracts Views on Vision4Press platform.
Data correspond to usage on the plateform after 2015. The current usage metrics is available 48-96 hours after online publication and is updated daily on week days.
Initial download of the metrics may take a while.